
Data Questions
Who is eligible?
Who requests assistance?
Who do we help?
How do we help?
What resources are required?
Snapshot
How many people does your organization help/serve?
What are the demographics of the people we help/serve?
How many people from your defined groups (e.g., vulnerable populations) are helped/served?
How many people with certain categories of legal problems does your organization help/serve?
What are the legal problems of the people your organization helps/serves?
How many of your clients are served by staff and how many by pro bono volunteers?
How many people is your organization unable to help (not served)?
How many people are helped/served per funding source?
Snapshot
Snapshot analyses measure counts or percentages for a given period, usually the most recently completed year. If any counts or percentages are unexpected, comparison, trend or spatial analyses may be necessary to better understand the reasons for the unexpected results.
Example Data Question
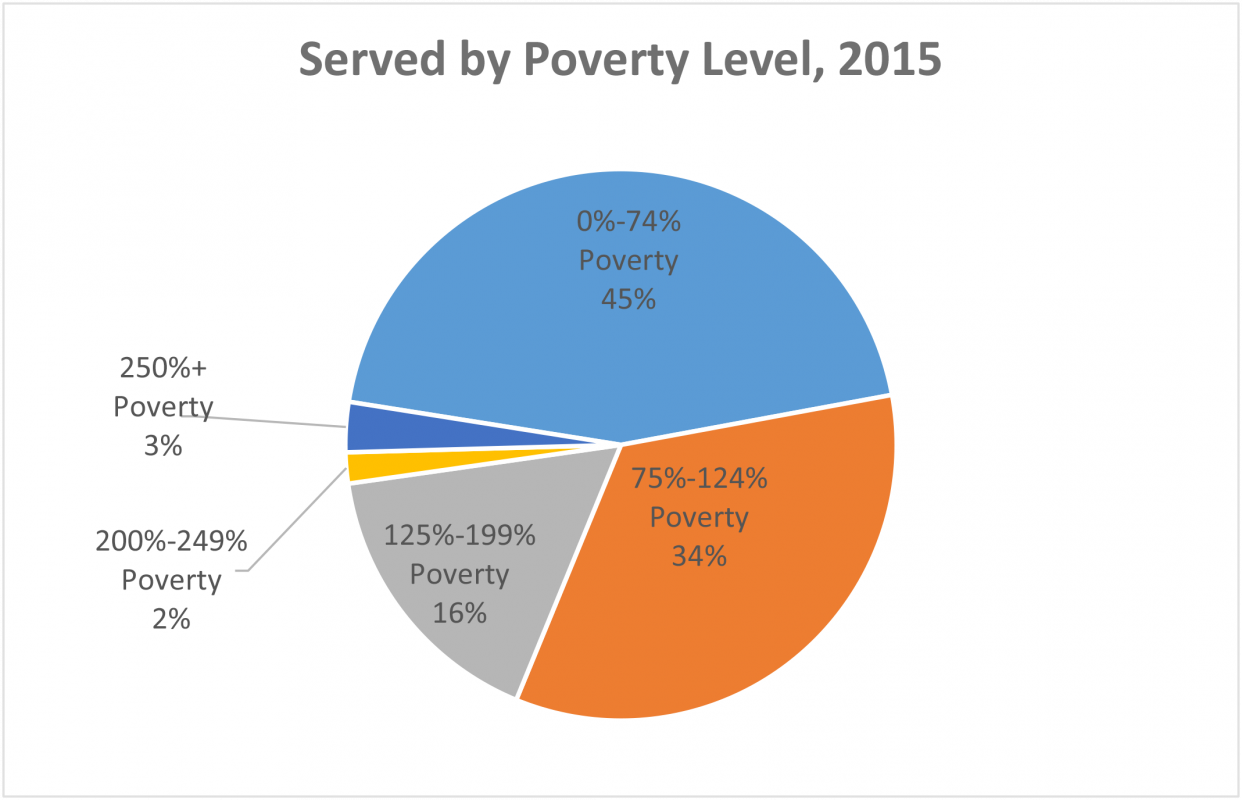
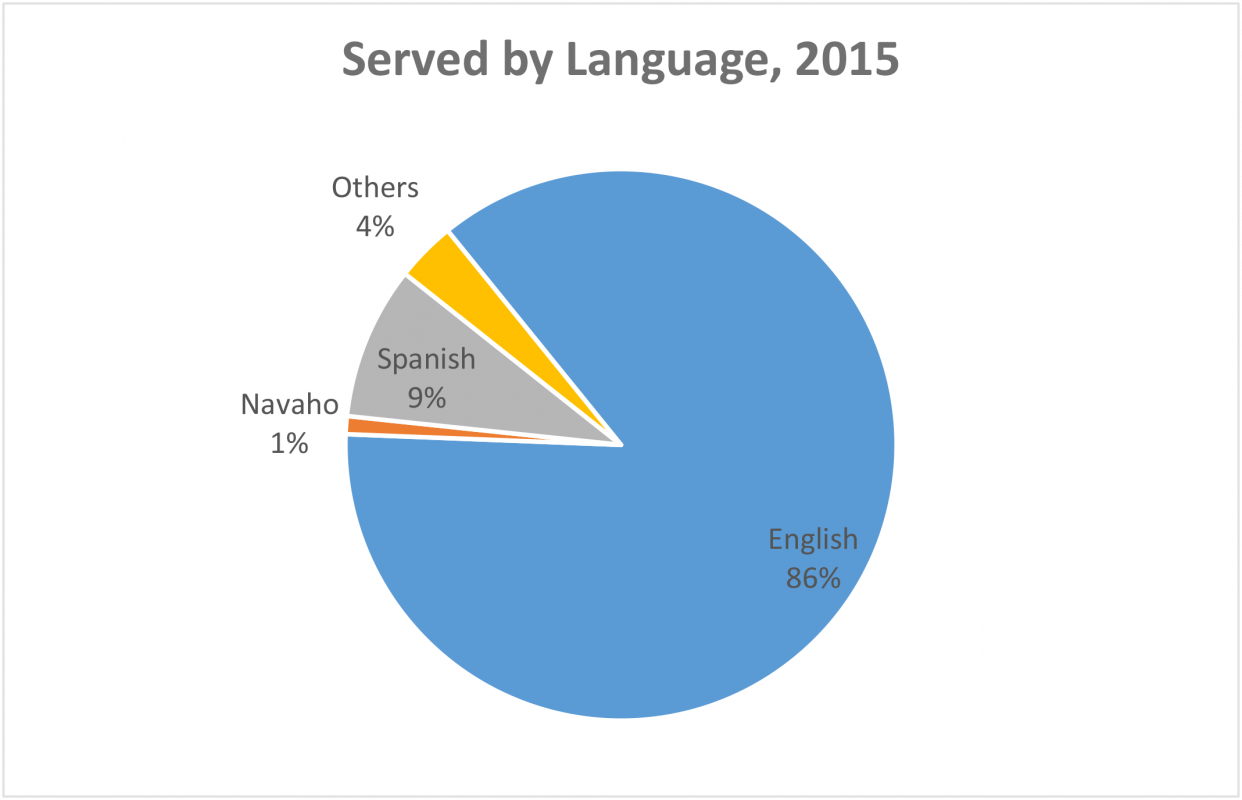
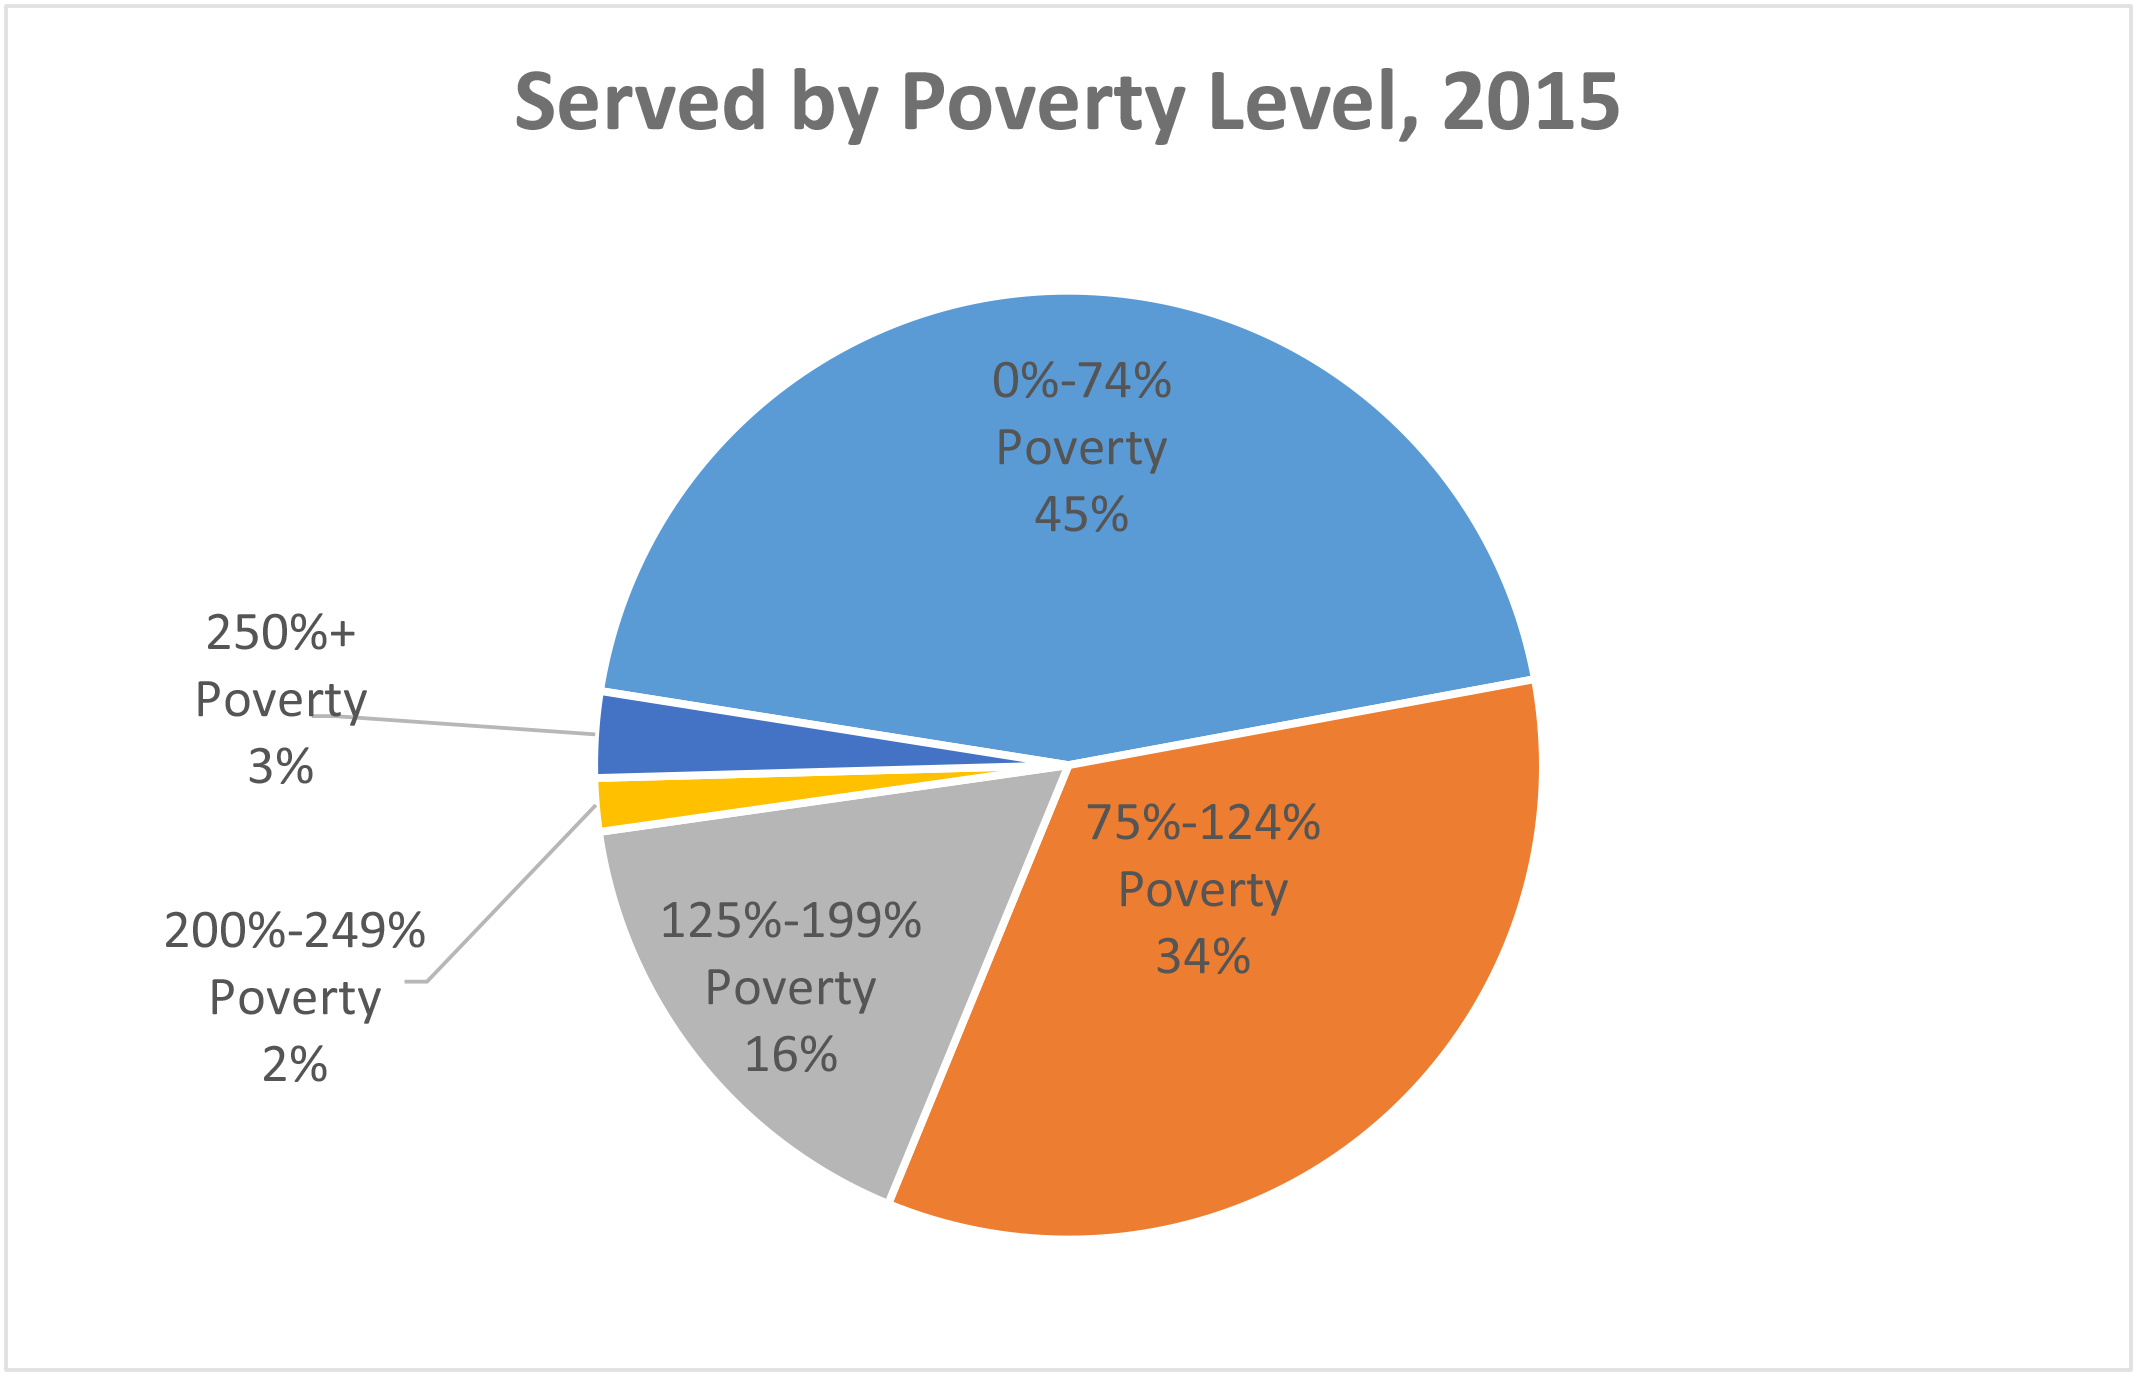
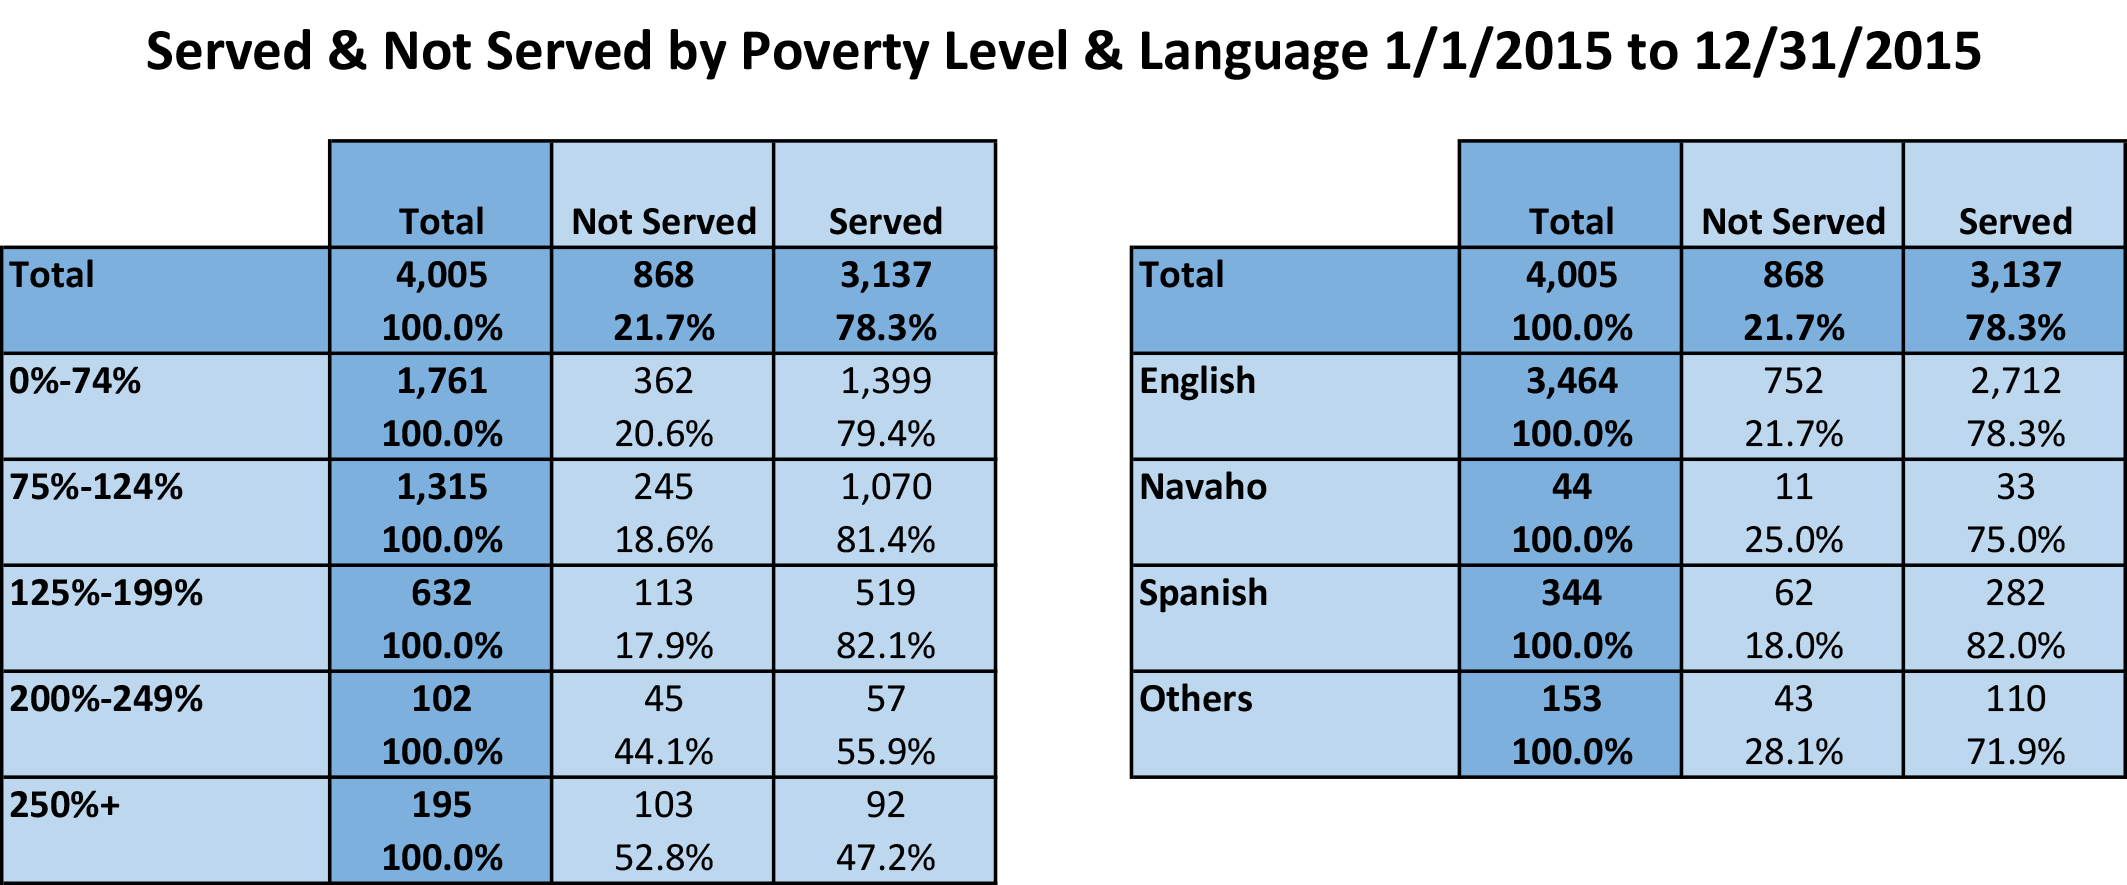
What are the demographic characteristics (example: poverty levels and language) of the people who requested assistance and received it in the last 12 months? What about those who did not receive service?
Multiple Analyses Are Possible
- Are the proportional share of clients served by various demographics what you would expect? If not, can you explain the difference? For example, did you expect that the largest share of clients receiving service would have poverty levels under 75%?
- Are the percentages of clients served and not served by each demographic characteristic what you would expect? If not, can you explain the difference? For example, were you surprised to see that non-English speakers receive service most of the time?
Data Sources
Intake and Closed Case data from your case management system, including
- Fields that determine whether a client was served or not, such as case status and/or close code
- Demographics about which you are curious
- Open date and close date
- Other case information that you might be able to use in other analyses, including problem code, other demographics, etc.
- Exclude cases that were identified as errors or duplicates
Example Analyses Steps
- Collect information about intakes and closed cases from your CMS for the most recently completed year.
- Create tables, pivot tables, cross tabs, or charts within Crystal Reports, Excel, or whichever analysis software you prefer that show the count and proportions of cases served and not served by each demographic characteristic (Excel pie charts and Crystal Reports cross tabs shown in this example).
- Create categories, such as poverty levels so the analysis is in summary form and easier to review.
- Percentages should be considered together with the number of cases. A high percentage on a low number of cases may be less significant than a high percentage on a high number of cases.

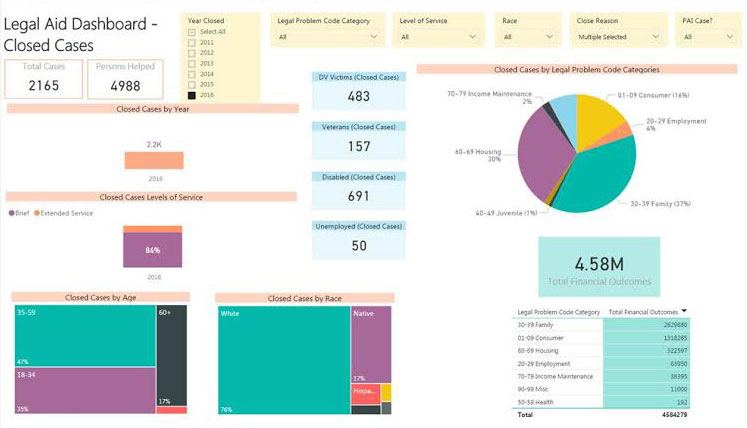
Another Tool for Analysis: Microsoft Power BI (MPBI)
- With your case management system data exported to Excel, you can use MPBI to easily create visuals like the ones in the Closed Cases Dashboard below.
- Download MPBI Desktop for free at: https://powerbi.microsoft.com/en-us/
