
Data Questions
Who is eligible?
Who requests assistance?
Who do we help?
How do we help?
What resources are required?
Trend
How has the number of people helped/served changed?
How have the demographics of people helped/served changed?
How have the number of people helped/served from your defined groups changed?
How has the number of people helped/served with certain categories of legal problems changed?
How has the number of people helped/served with different legal problems changed?
How has the number of people helped/served by staff vs. pro bono volunteers changed?
How has the number of people not helped/not served changed?
How have the demographics of people not helped/not served changed?
Trend
Trend analyses scrutinize changes over time in client conditions. Review trends over a five-year period, or longer when possible. Spikes or dips that appear in trends might confirm what an organization expects or raise additional questions worthy of investigation to better understand the unexpected change and determine whether it calls for proactive steps.
Example Data Question
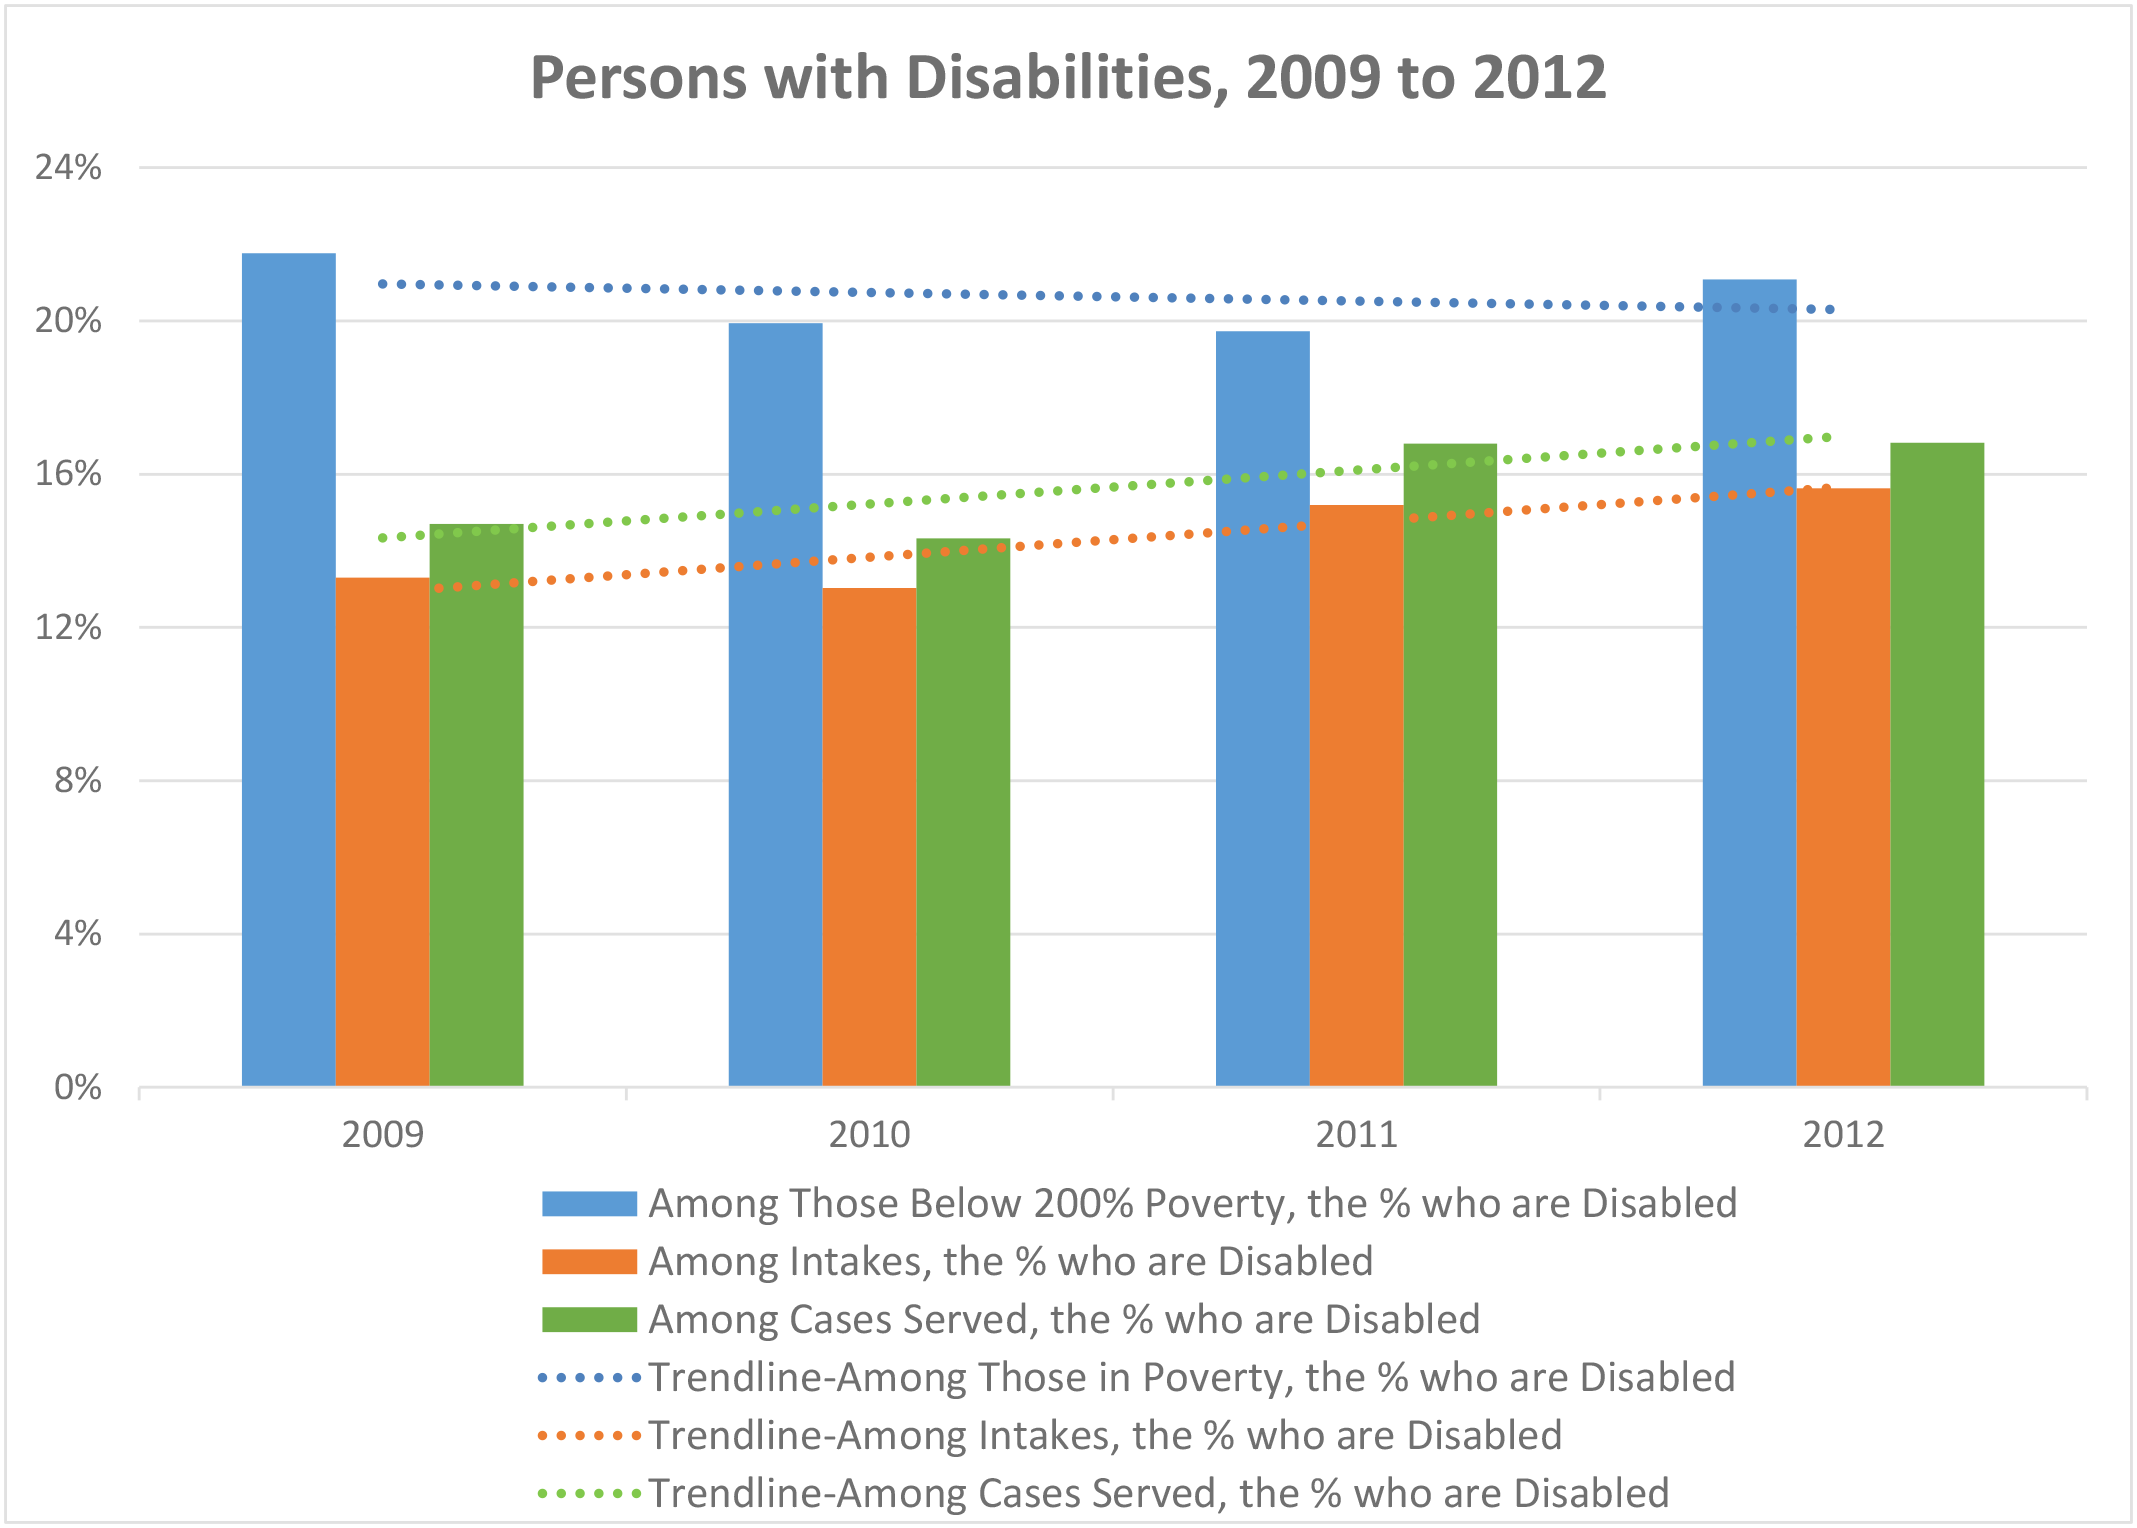
How has the number of disabled people receiving assistance from our organization changed over time? And how does that trend compare to the trends in the number of eligible disabled people and intakes for disabled people?
Multiple Analyses Are Possible
- How do the trends in intake numbers and cases served numbers compare to the trends in eligible disabled population numbers?
- What have been the annual changes in intakes and cases served compared to the annual changes in the eligible disabled population over time?
- How do the trends in the proportion of all intakes made up of disabled people and the proportion of all cases served made up of disabled clients compare to the trends in the proportion of eligible people who are disabled people? If there is a difference in the proportions, is that acceptable? Do you know why there is a difference?
Data Sources
Intake and Closed Case data from your case management system, including
- Fields that determine whether a client was served or not, such as case status and/or close code
- Demographics about which you are curious
- Open date and close date
- Other case information that you might be able to use in other analyses, including problem code, other demographics, etc.
- Exclude cases that were identified as errors or duplicates
- Note that some organizations will need to be creative in their methods of identifying disabled clients. If there is a field that indicates client disability, make sure to use it. But you may need to supplement it with additional data, such as sources of income that may include SSI, SSDI, Veteran’s disability benefits, etc.
U.S. Census American Community Survey data at the American Factfinder website (Advanced Search option)
- C18131 RATIO OF INCOME TO POVERTY LEVEL IN THE PAST 12 MONTHS BY DISABILITY STATUS
Example Analyses Steps
- Determine which fields from your case management system you will use to define disabled clients.
- Using that definition, find the numbers of intakes and cases served for disabled clients over the last 5 years.
- Enter those numbers in an Excel spreadsheet and calculate the percentage of total intakes for disabled clients compared to all clients and total cases served for disabled clients compared to served cases for all clients.
- Open the ACS, Advanced Search.
- Click on the Geographies blue box on the left side of the screen.
- Select a geographic type from the drop down based on the most appropriate type for your service area (state, county, census tract, etc.).
- Click Add TO YOUR SELECTIONS and close the Select Geographies.
- In the “topic or table name” box, enter C18131 and select GO.
- Download the C18131 table to Excel for your area for the most recent 5 years (or as many as are available).
- For information about choosing 5-year, 3-year, or 1-year estimates, click here
- Enter the numbers of eligible disabled people from each of the C18131 tables into the Excel file with the intake and cases served numbers.
- Create a bar chart showing percentages of the share of all eligible people who are disabled, the share of all intakes for disabled people, and the share of all cases served for disabled people.
- Add trendlines.
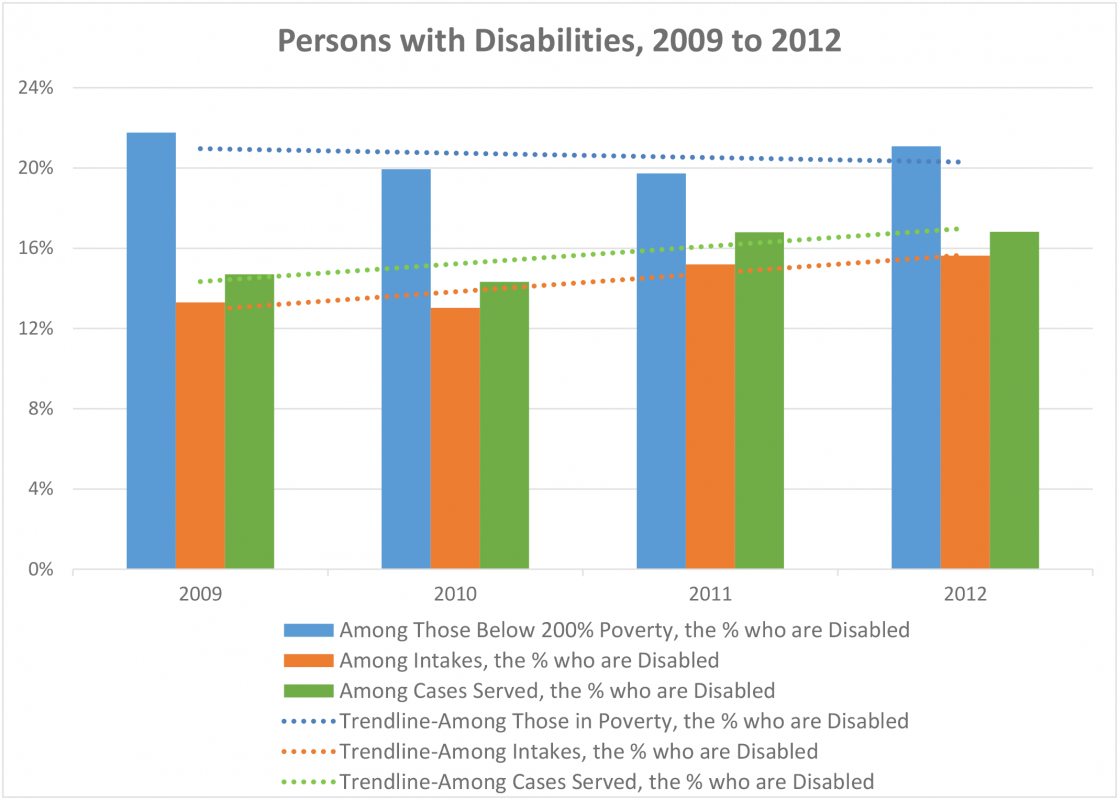
Note: Those considered disabled from Pika data include those with Disabled or Severely Disabled fields checked, Income=Disability Financial Assistance or SSI (for client), Problem Code=74 (SSDI), 75 (SSI), 82 (Mental Health), or 84 (Physical disabled rights) or SP-Problem=77-5 (Veterans disability benefits).
Sources: U.S. Census Bureau; American Community Survey, 2009, 2010, 2011, 2012 ACS 1-year estimates; Tables S1701 & C18131; generated by Rachel Perry; using American FactFinder; http://factfinder2.census.gov (March 2014) & Legal Aid Pika data 2009-2012.
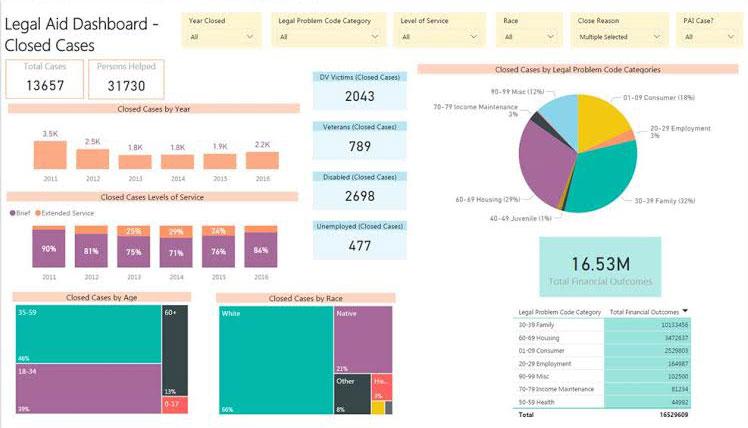
Another Tool for Analysis: Microsoft Power BI (MPBI)
- With your case management system data exported to Excel, you can use MPBI to easily create visuals like the ones in the Closed Cases Dashboard below.
- Download MPBI Desktop for free at: https://powerbi.microsoft.com/en-us/