Data Questions
Who is eligible?
Who requests assistance?
Who do we help?
How do we help?
What resources are required?
Comparison
How does the number of people served compare to the number of eligible people?
How do the demographics of the people served and not served vary for different legal problems?
Which legal problems are served and not served for people from different defined groups?
Which legal problems are served and not served by staff versus pro bono volunteers?
Comparison
Comparison analyses review linkages between two or more variables and uncover information about client conditions and data relationships. When unexpected data relationships are discovered, investigation is warranted to better understand linkages and determine whether they indicate the need for client service and advocacy work that simultaneously targets multiple conditions at once.
Example Data Question
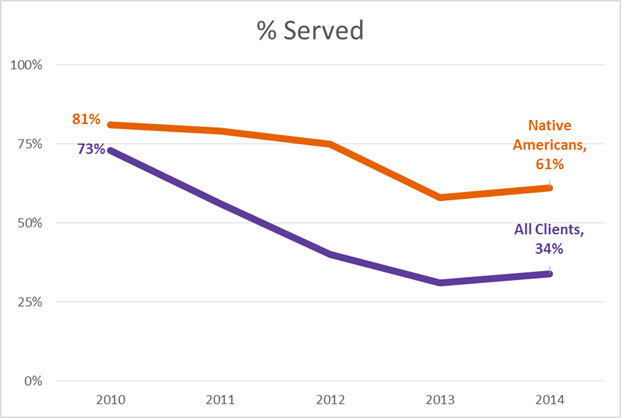
How does the percentage served for a particular demographic group (example: Native Americans) compare to the percentage served for all clients?
Multiple Analyses Are Possible
- If the percentage of Native Americans served is different from the overall percentage of clients served, do we know why?
- Does the percentage of Native Americans served satisfy our organizational goals and priorities?
- How do the annual changes in cases served for Native Americans compare to the annual changes in the eligible Native American population?
Data Sources
Intake and Closed Case data from your case management system, including
- Fields that determine whether a client was served or not, such as case status and/or close code
- Demographics about which you are curious, including race
- Open date and close date
- Other case information that you might be able to use in other analyses, including problem code, other demographics, etc.
- Exclude cases that were identified as errors or duplicates
Example Analyses Steps
- Collect case management system data about cases served and not served by race for the last 5 years.
- Separate out the numbers of cases served and not served for Native American clients and for all clients over the last 5 years.
- Enter those numbers in an Excel spreadsheet and calculate the percentages of total cases served for Native Americans compared to cases served for all clients.
- Create a line graph showing percentages served for all cases compared to cases for Native Americans