
Data Questions
Who is eligible?
Who requests assistance?
Who do we help?
How do we help?
What resources are required?
Snapshot
To how many people does your organization provide brief services vs. extended services?
What are the demographics of the people who receive brief services vs. extended services?
Do you want to know how many people from your defined groups (e.g., vulnerable populations) receive brief services vs. extended services?
How many people with certain categories of legal problems receive brief vs. extended services?
What are the legal problems of the people who receive brief vs. extended services?
How many of your clients served by staff and how many by pro bono receive brief vs. extended services?
What are the outcomes for your clients?
Snapshot
Snapshot analyses measure counts or percentages for a given period, usually the most recently completed year. If any counts or percentages are unexpected, comparison, trend or spatial analyses may be necessary to better understand the reasons for the unexpected results.
Example Data Question
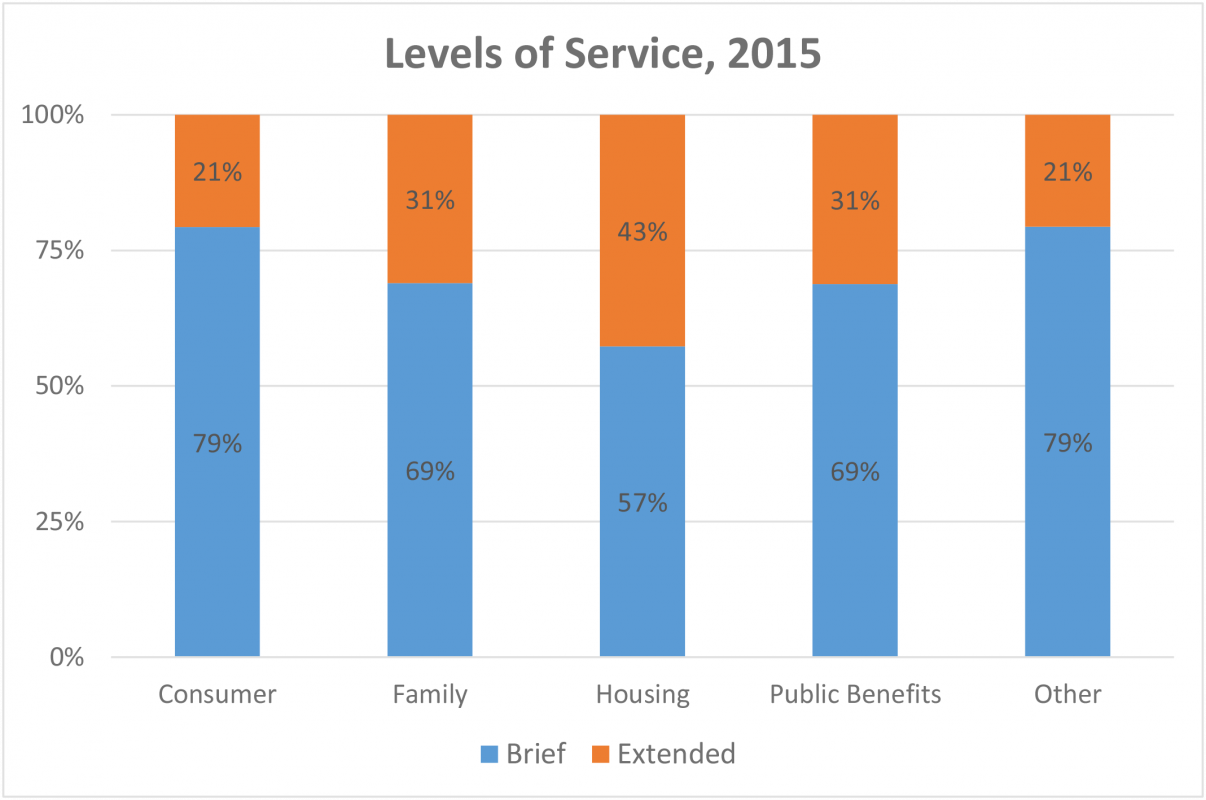
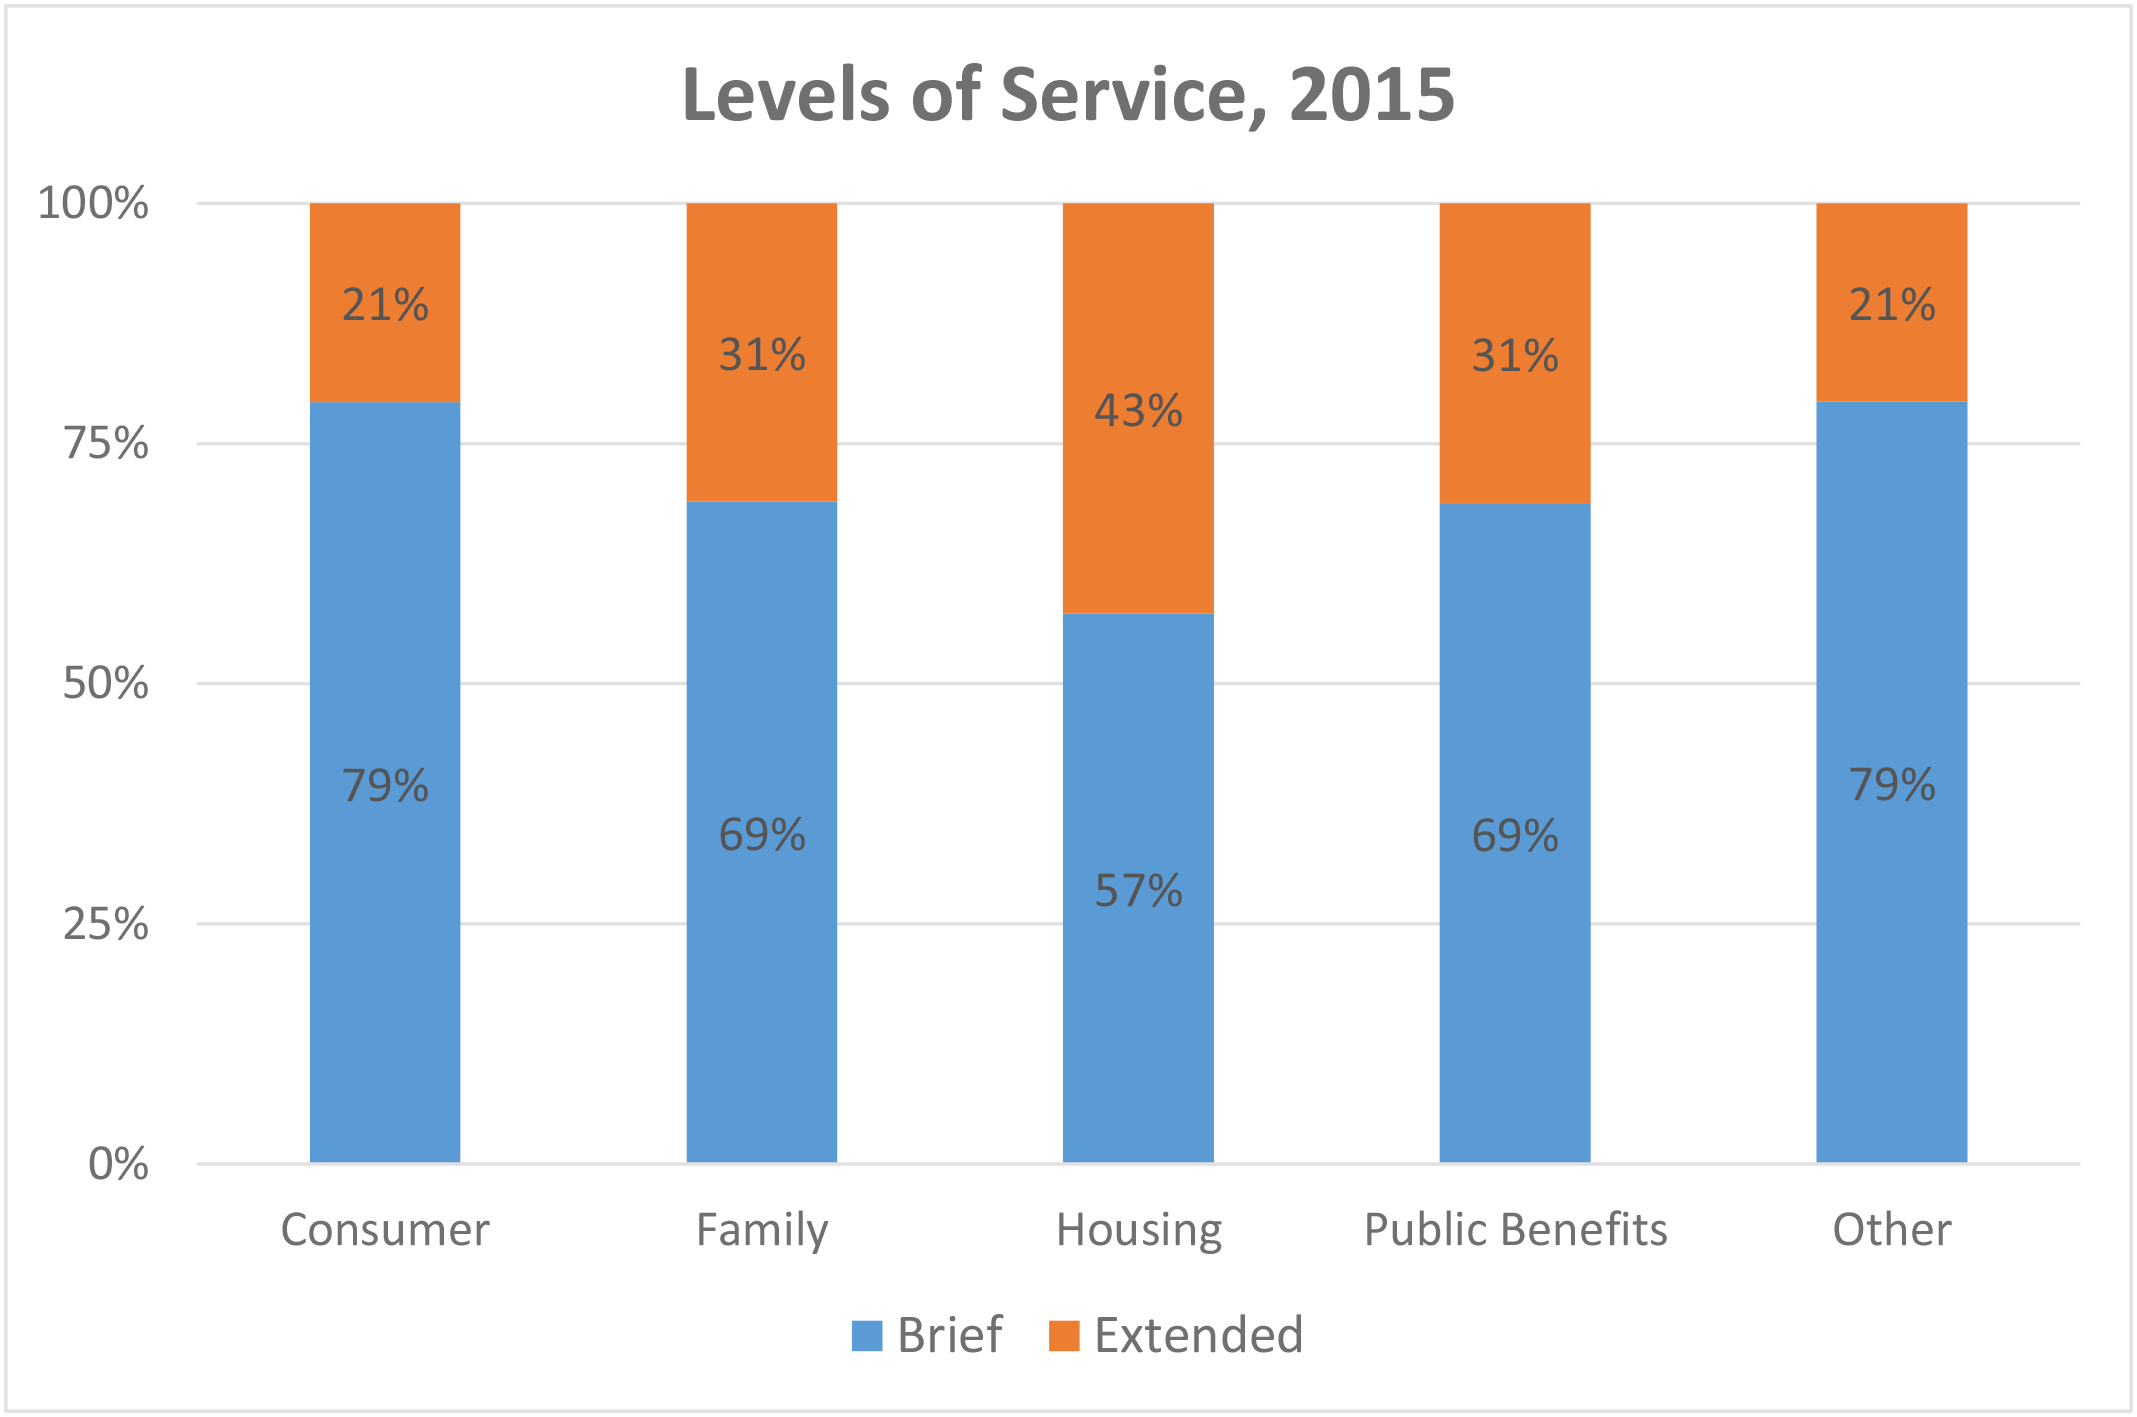
How many people with certain categories of legal problems receive brief service vs. extended service?
Multiple Analyses Are Possible
- Is the percentage of brief service and the percentage of extended service what you would expect for the legal problem code categories? If not, can you explain the difference?
- Does the breakdown between brief service and extended service cases meet organizational goals, particularly related to the volume of extended service cases?
Data Sources
Closed Case data from your case management system, including
- Fields that determine whether a client received brief or extended service, such as close code
- Problem codes
- Demographics about which you are curious
- Open date and close date
- Other case information that you might be able to use in other analyses, including other demographics, etc.
Example Analyses Steps
- Find the total cases closed with both brief service and extended service from your CMS for the most recently completed year.
- Sort the cases by the categories of legal problems meaningful to your organization.
- Create a graph within Crystal Reports, Excel, or whichever analysis software you prefer (Excel Column Chart shown in this example) that shows the proportional share of cases closed with brief versus extended service.
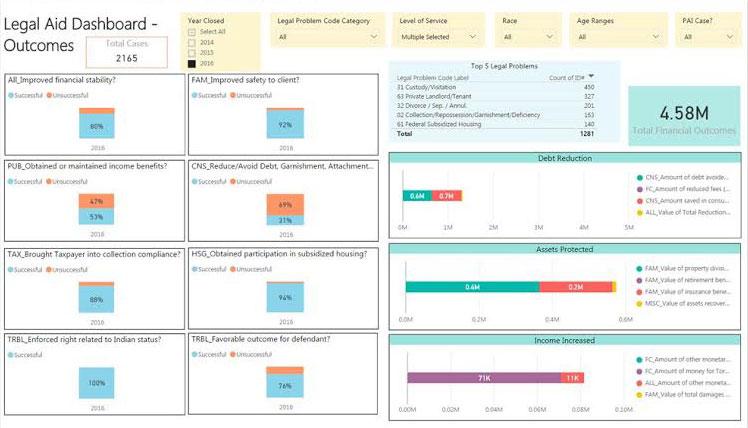
Another Tool for Analysis: Microsoft Power BI (MPBI)
- With your case management system outcome data exported to Excel, you can use MPBI to easily create visuals like the ones in the Outcomes Dashboard below.
- Download MPBI Desktop for free at: https://powerbi.microsoft.com/en-us/