
Data Questions
Who is eligible?
Who requests assistance?
Who do we help?
How do we help?
What resources are required?
Trend
How have brief service cases and extended service cases changed?
How have the demographics of the people receiving brief service vs. extended service changed?
How have the number of people from your defined groups receiving brief vs. extended service changed?
How has the number of people with certain categories of legal problems receiving brief vs. extended service changed?
How has the number of people with different legal problems receiving brief vs. extended service changed?
How has the number of people served by staff vs. pro bono volunteers receiving brief vs. extended service changed?
How have outcomes changed?
Trend
Trend analyses scrutinize changes over time in client conditions. Review trends over a five-year period, or longer when possible. Spikes or dips that appear in trends might confirm what an organization expects or raise additional questions worthy of investigation to better understand the unexpected change and determine whether it calls for proactive steps.
Example Data Question
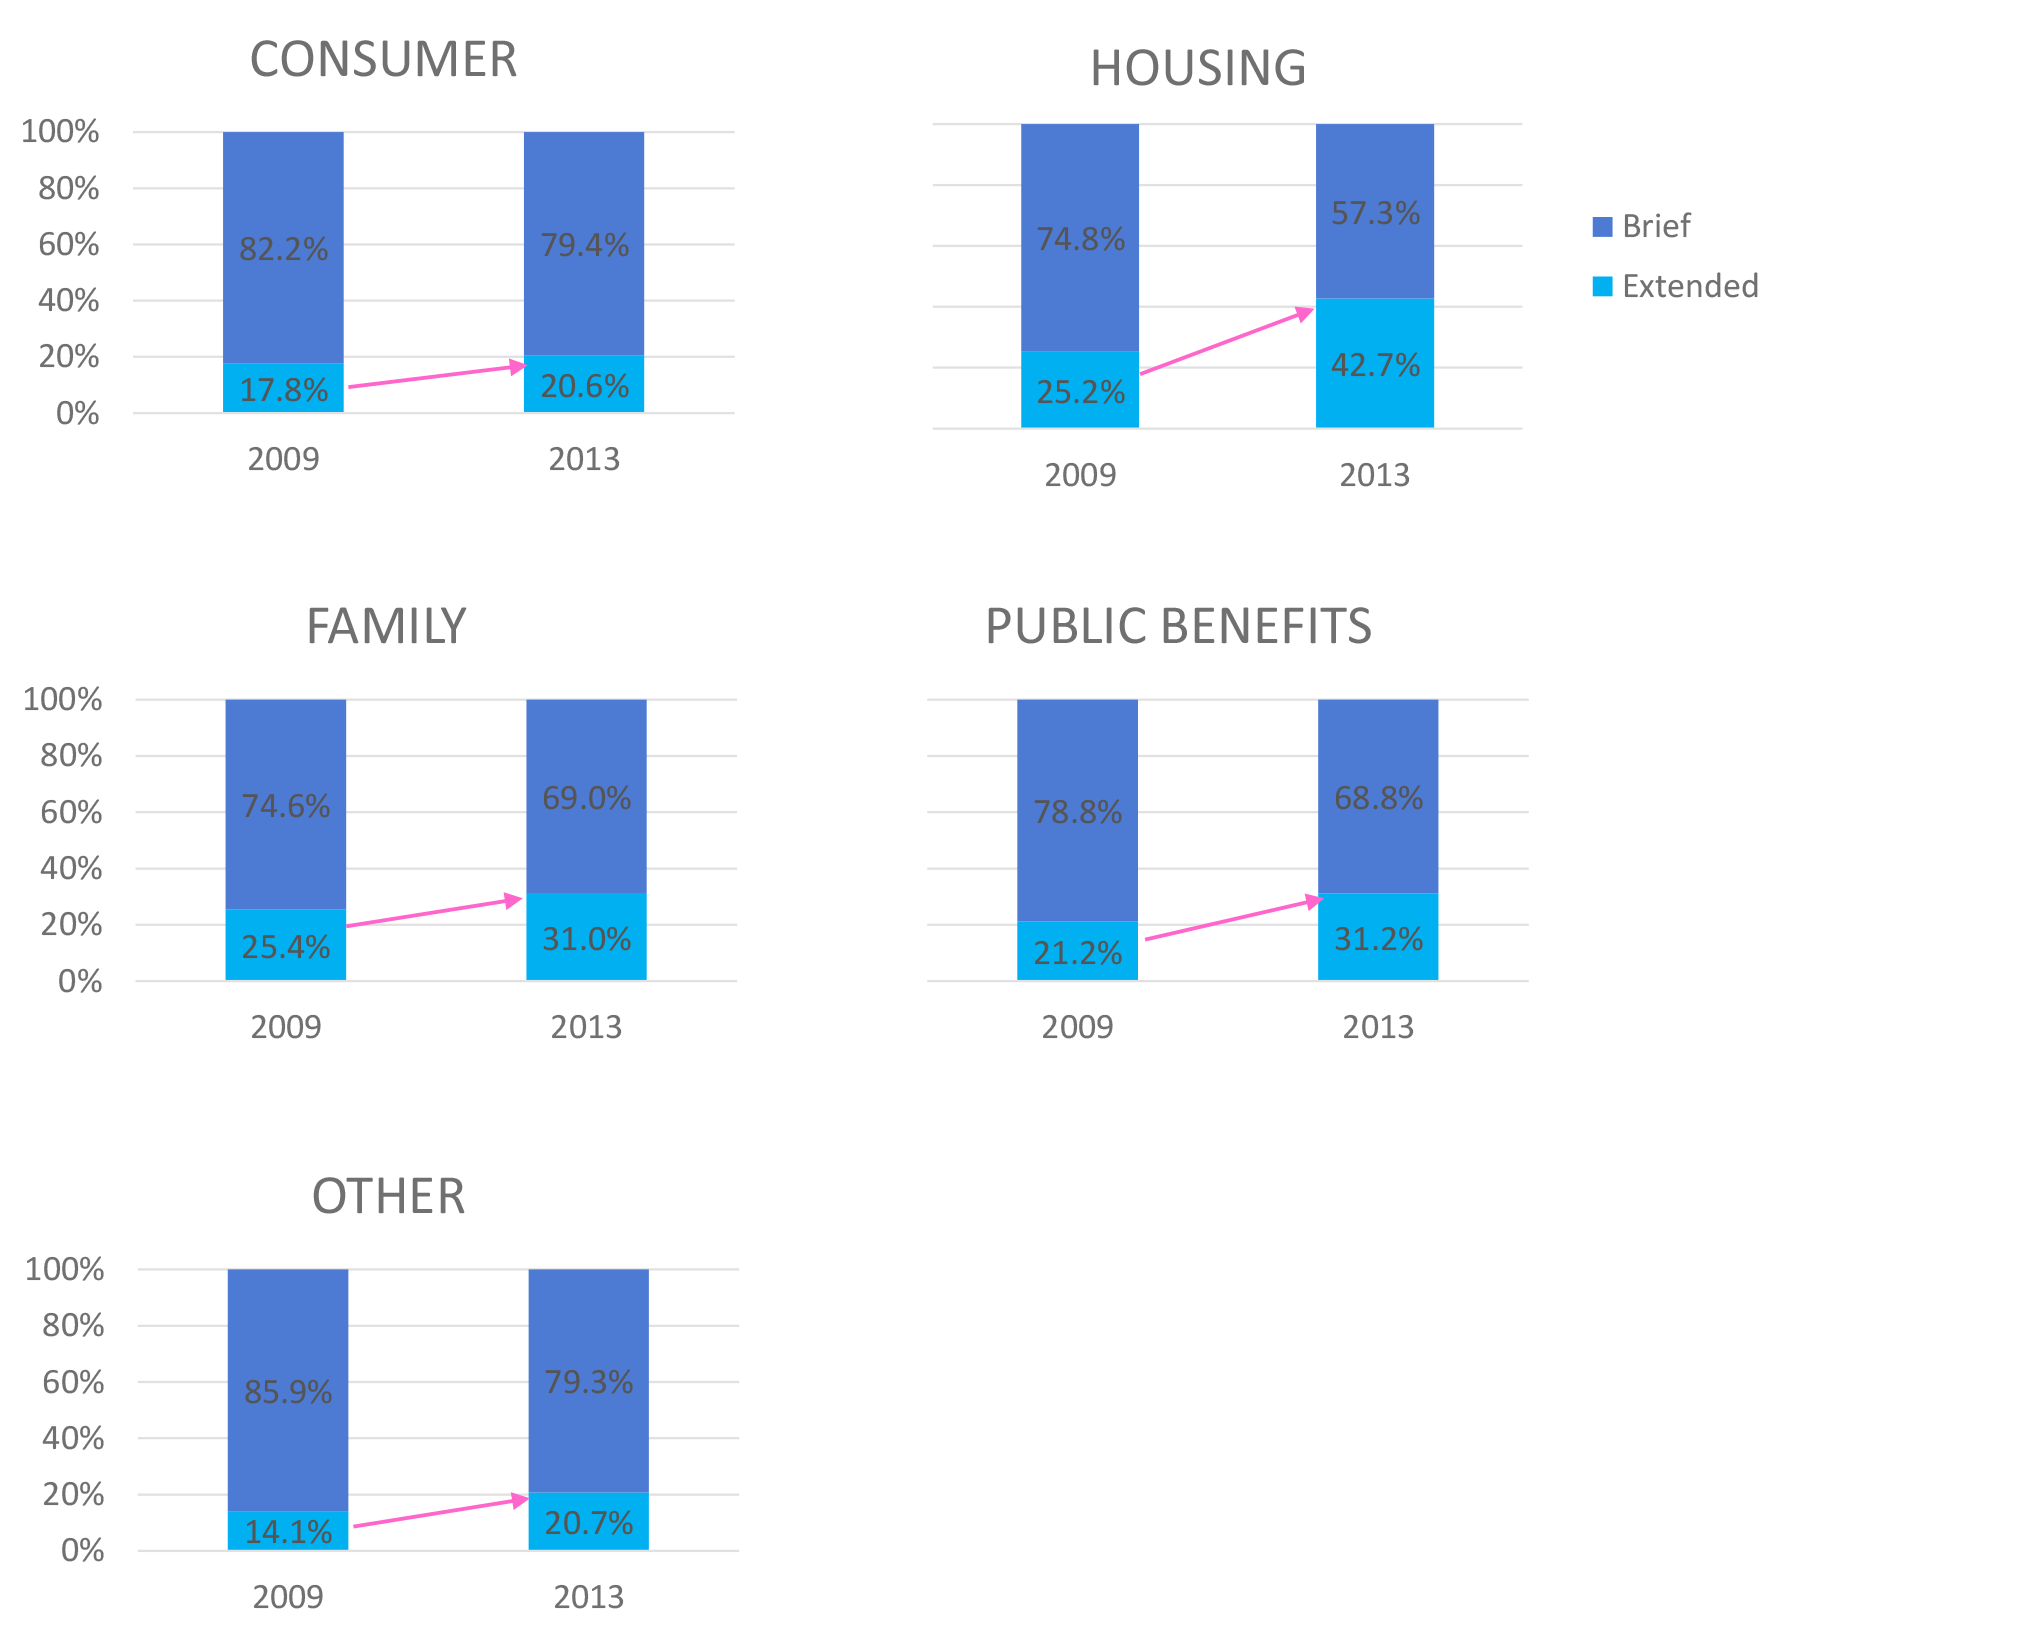
Has our organizations increased or decreased the share of cases receiving extended service? Does it vary by subject area?
Multiple Analyses Are Possible
- Has the level of service our clients receive changed? If so, do we know why?
- Do different types of cases warrant more extended service or more brief service and advice?
- How has the level of service changed over time by various categories, such as case type or demographics?
Data Sources
Closed case data from your case management system, including
- Fields that determine whether a client received brief or extended service, such as close code
- Demographics about which you are curious
- Open date and close date
- Other case information that you might be able to use in other analyses, including problem code, other demographics, etc.
- Exclude cases that were identified as errors or duplicates
Example Analyses Steps
- Gather counts of cases closed with brief service or advice and those closed with extended service over the past 5 years, or for the most recent calendar year and the 5 years prior.
- Using whichever analysis software you prefer (Excel bar charts shown in this example), compare proportions of cases based on level of service.
- You may want to make these comparisons for all cases, by practice group, by clients’ demographics, by county, etc.
- Consider adding arrows to show whether trends are increasing or decreasing for the percentage of cases receiving extended service.

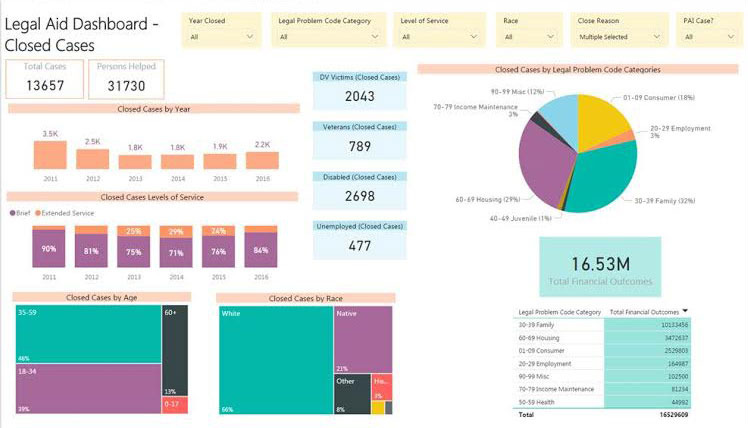
Another Tool for Analysis: Microsoft Power BI (MPBI)
- With your case management system outcome data exported to Excel, you can use MPBI to easily create visuals like the ones in the Outcomes Dashboard below.
- Download MPBI Desktop for free at: https://powerbi.microsoft.com/en-us/
