Data Questions
Who is eligible?
Who requests assistance?
Who do we help?
How do we help?
What resources are required?
Comparison
How does level of service differ by legal problem among different demographics?
How does level of service differ by legal problem among different defined groups?
How does level of service differ by legal problem among different substantive groups?
How does level of service differ by legal problem between cases served by staff and cases served by pro bono volunteers compare?
How do the outcomes compare for people with different demographics?
Comparison
Comparison analyses review linkages between two or more variables and uncover information about client conditions and data relationships. When unexpected data relationships are discovered, investigation is warranted to better understand linkages and determine whether they indicate the need for client service and advocacy work that simultaneously targets multiple conditions at once.
Example Data Question
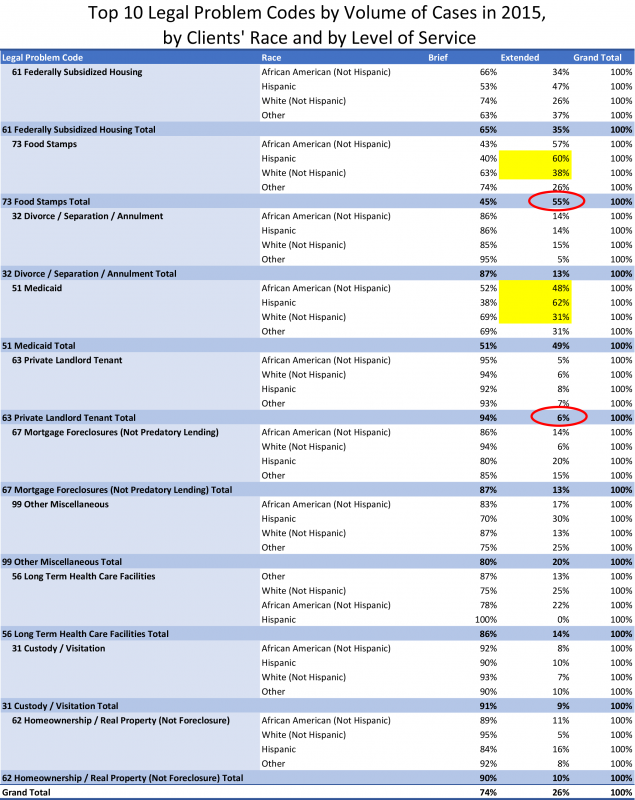
How does levels of service differ by legal problem among different racial categories? (Note that because many legal aids count Hispanic as a race rather than ethnicity, it is considered a racial category in this example analysis).
Multiple Analyses Are Possible
- Which legal problem code(s) have the highest percentage of extended service cases?
- Example: Do you know why 55% of 73-Food Stamps receive extended service while 6% of 63-Private Landlord Tenant cases receive extended service?
- Within problem code groupings, do clients with different races have similar percentages of extended service?
- Example: Do you know why 60% of Hispanic clients with Food Stamp cases received extended service while 38% of White (Not Hispanic) clients with Food Stamp cases received extended service?
- Example: Do you know why 48% of African American clients with Medicaid cases received extended service while 62% of Hispanic clients and 31% of White (Not Hispanic) clients with Medicaid cases received extended service?
Data Sources
Intake and Closed Case data from your case management system, including
- Fields that determine whether a client was served or not, such as case status and/or close code
- Demographics about which you are curious, including race
- Open date and close date
- Problem Code
- Other case information that you might be able to use in other analyses, including other demographics, etc.
- Exclude cases that were identified as errors or duplicates
Example Analyses Steps
- Find the total cases closed with both brief service and extended service from your case management system for the last three years.
- Using whichever analysis software you prefer (Excel pivot table shown in this example), sort data by legal problems and limit your review to the top 10 most prevalent legal problems.
- Further sort by Race.
- Show percentage split between brief and extended service.
- Highlight results that deserve special attention. In this example, the data relevant to the questions in the “Multiple analyses are possible section” above are highlighted in the table below.