Data Questions
Who is eligible?
Who requests assistance?
Who do we help?
How do we help?
What resources are required?
Trend
How have organizational total hours changed?
How have hours by substantive area changed?
How have hours by legal problem code changed?
How have staff and pro bono hours changed?
Trend
Trend analyses scrutinize changes over time in client conditions. Review trends over a five-year period, or longer when possible. Spikes or dips that appear in trends might confirm what an organization expects or raise additional questions worthy of investigation to better understand the unexpected change and determine whether it calls for proactive steps.
Example Data Question
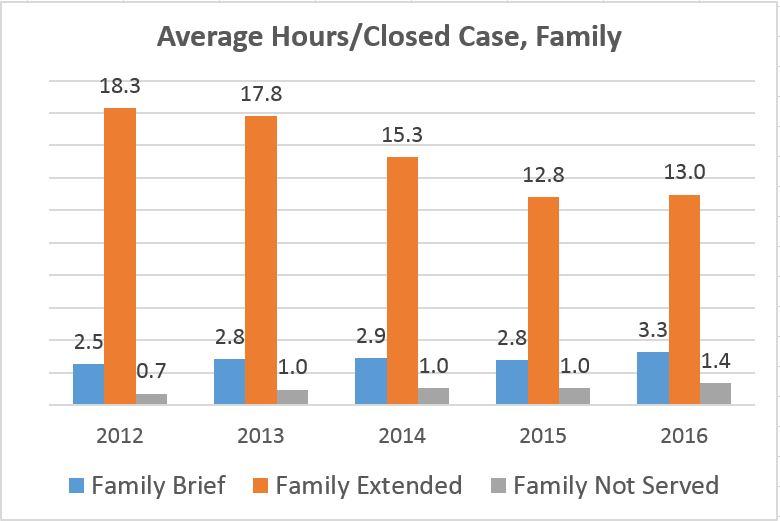
What is the average hours per case that we spend on cases that we serve with brief and extended service versus those we cannot serve (example: Family Law Cases)?
Multiple Analyses Are Possible
- How has the average hours/case on Family Law cases closed with Brief and Extended service changed over time?
- Are we spending too much time on Brief Service cases? Should some of them be closed with Extended Service?
- How much time are we spending on Family Law cases that we don’t end up serving? Should some of those cases be closed with service? How has our time spent on cases not served changed over time?
Data Sources
Intake and Closed Case data from your case management system, including:
- Fields that determine whether a client was served or not, such as case status and/or close code
- Fields that show hours worked on cases
- Problem codes
- Open date and close date
- Other case information that you might be able to use in other analyses, demographics, etc.
- Exclude cases that were identified as errors or duplicates, but make sure to keep cases that ended up not being served
Example Analyses Steps
- Export the total cases closed (including served or not served) from your CMS to a spreadsheet for the most recently completed five years for a particular category of legal problems (Family Law cases in this example).
- Sort the cases by whether they received service or did not receive service (usually based on closed code and/or case status). If they did receive service, sort them additionally by whether they received brief service or extended service.
- Subtotal the hours worked for served brief, served extended, and not served cases for each year and divide the total hours by the total number of served brief, served extended, and not served cases to get average hours per case for each year.
- Create a graph within Crystal Reports, Excel, or whichever analysis software you prefer (Excel Column Chart shown in this example) that shows the average hours per case for served brief, served extended, and not served cases each year.
- Give served brief cases a different color from served extended and not served cases to make the graph easy to understand.