
Data Questions
Who is eligible?
Who requests assistance?
Who do we help?
How do we help?
What resources are required?
Snapshot
How many people are eligible?
What are the demographics of people who are eligible?
Do you have defined groups about which you want to understand current eligibility (e.g., vulnerable populations)?
Snapshot
Snapshot analyses measure counts or percentages for a given period, usually the most recently completed year. If any counts or percentages are unexpected, comparison, trend or spatial analyses may be necessary to better understand the reasons for the unexpected results.
Example Data Question
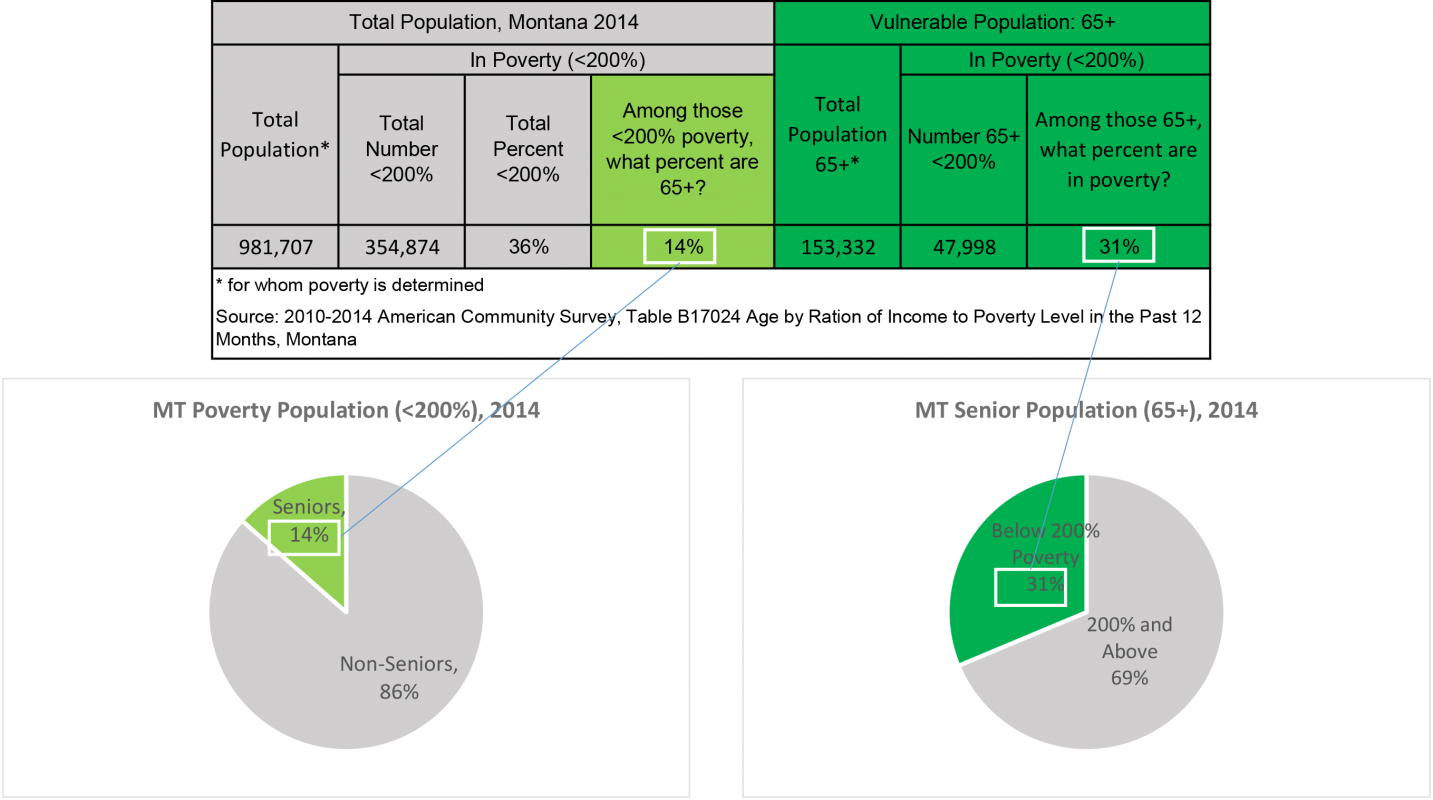
How many people with specific demographic characteristics (example: seniors, 65+) are eligible for our services?
Multiple Analyses Are Possible
- What proportion of our service area’s poverty population includes seniors?
- What percentage of our area’s seniors are in poverty?
- These numbers can be compared to internal data regarding the percentage of our clients who are seniors. Should it match the portion of the poverty population who are seniors?
- Does a high proportion of seniors in poverty make that population a higher priority for our organization?
Data Sources
U.S. Census American Community Survey data at the American Factfinder website (Advanced Search option)
- For data at various levels of poverty (including below 125%) senior age categories of 55-64, 65-74, and 75+:
- B17024: AGE BY RATIO OF INCOME TO POVERTY LEVEL IN THE PAST 12 MONTHS
- For data at only below 100% poverty and age categories of 60+ or 65+:
- S1701: POVERTY STATUS IN THE PAST 12 MONTHS
Example Analyses Steps
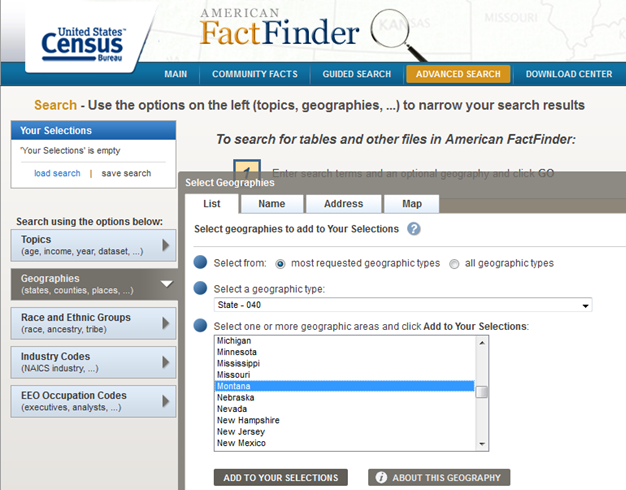
- Open the ACS, Advanced Search.
- Click on the Geographies blue box on the left side of the screen.
- Select a geographic type from the drop down (in this example: geographic type is state, state is Montana).
- Click Add TO YOUR SELECTIONS and close the Select Geographies window.
- In the “topic or table name” box, enter B17024 or S1701 (depending on the data categories you need) and select GO.
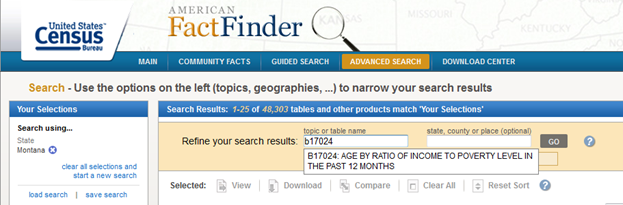
- From the list of tables that appear, click on the latest available 5-year estimate.
- For information about choosing 5-year, 3-year, or 1-year estimates, click here
- Download the table to Excel.
- If the numbers downloaded into Excel as text, highlight the relevant cells, right click, and select Convert to Number.
- Perform calculations (including adding up all the numbers of people under 200% poverty (because that is a good proxy for identifying all eligible people) from the various age groups in the B17024 data).
- Create a table like the one below in which the results of your calculations can be entered.
- Create pie charts or other graphics, if helpful.