Data Questions
Who is eligible?
Who requests assistance?
Who do we help?
How do we help?
What resources are required?
Geographic Concentration
Does the geographic concentration of the eligible population match the concentration of people from your defined groups?
Geographic Concentration
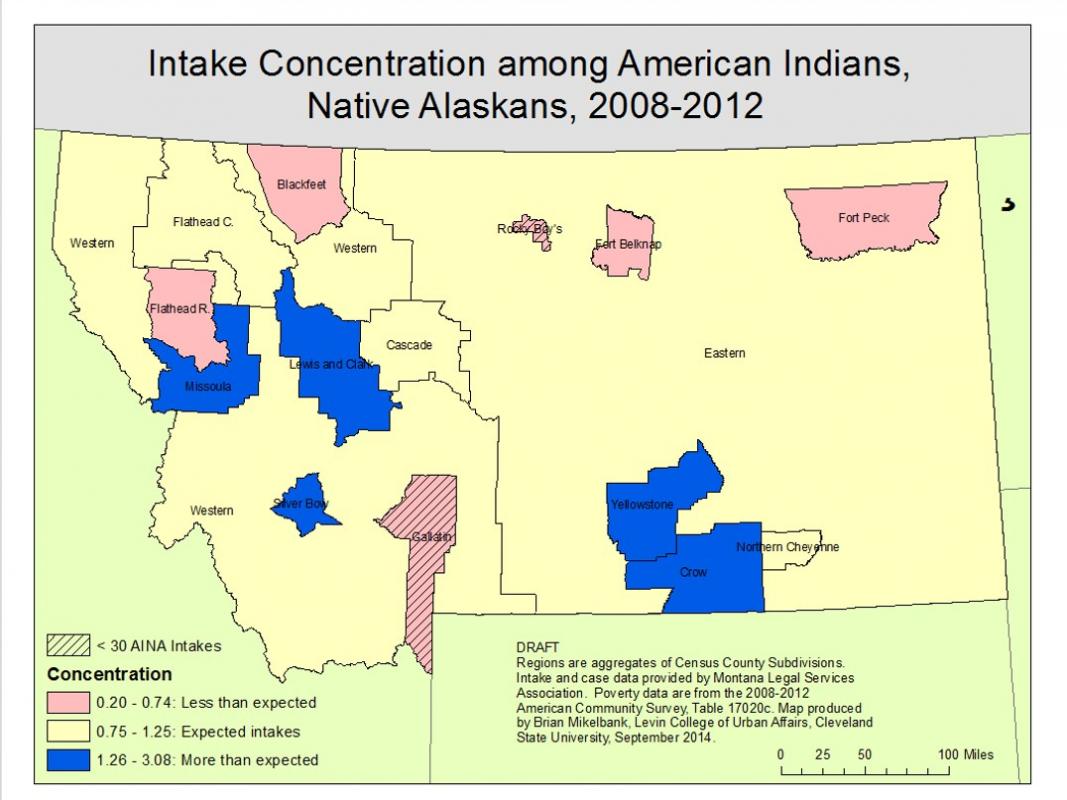
Geographic Concentration analyses compare geographic concentrations (high or low) of multiple variables to determine how the variables and location impact each other. Our concentration maps display location quotients.
Example Data Question
How does the proportion of people requesting assistance from different parts of our service area compare to the proportion of eligible people in those same areas?
Multiple Analyses Are Possible
- Identifying concentration allows you to move beyond questions of “high/low” to questions of “more than expected or less than expected”.
- The location quotient is a commonly used measure of concentration, and it can yield important insights into the data. Learn more on the Location Quotient.
- Are there communities in your service area generating fewer than expected intakes (LQ <1)? Why might that be?
- Are there communities in your service area generating more than expected intakes (LQ>1)? Do you know why?
- Are levels of concentration throughout your service area (the distribution of LQs on a map) the result of a conscious effort on the part of your organization, or is it simply determined by the population seeking your services?
Data Sources
Intake data from your case management system, including
- Demographics about which you are curious
- Open date and close date
- Other case information that you might be able to use in other analyses, including problem code, other demographics, etc.
- Exclude cases that were identified as errors or duplicates, but make sure to keep cases that ended up not being served
U.S. Census American Community Survey data at the American Factfinder website: http://factfinder2.census.gov (Advanced Search option)
- S1701: POVERTY STATUS IN THE PAST 12 MONTHS, 5 year estimate, by Census Tracts
Example Analyses Steps
- GIS mapping using ArcGIS or other similar software.
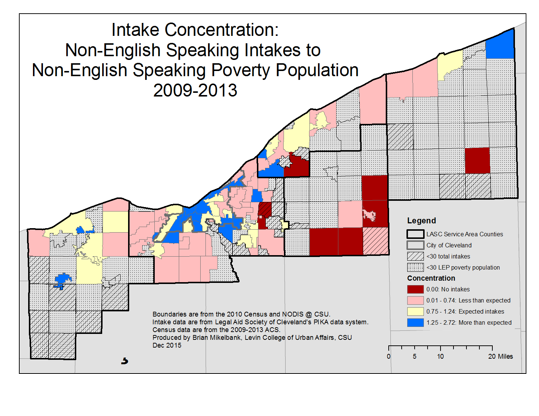
- These analyses combine two data sources. Your intake data are aggregated to the community level, to match the eligibility data (poverty levels) that you obtain from American Factfinder. The location quotient is simply one fraction divided by another but it reveals where your variable of interest is greater than or less than you would expect based on the underlying population. For example, in the Cleveland case, the near west side of Cleveland sees more non-English speaking intakes from the near west side, even taking into account the larger than average non-English speaking eligible population that lives there.