
Data Questions
Who is eligible?
Who requests assistance?
Who do we help?
How do we help?
What resources are required?
Snapshot
How many people request assistance from your organization?
What are the demographics of the people who request assistance?
How many people from your defined groups (e.g., vulnerable populations) request assistance?
How many people with certain categories of legal problems request assistance?
What are the legal problems of the people who request assistance?
How do people request assistance (walk-in, telephone, clinics, online, etc.)?
What outside organizations refer clients to your organization?
Snapshot
Snapshot analyses measure counts or percentages for a given period, usually the most recently completed year. If any counts or percentages are unexpected, comparison, trend or spatial analyses may be necessary to better understand the reasons for the unexpected results.
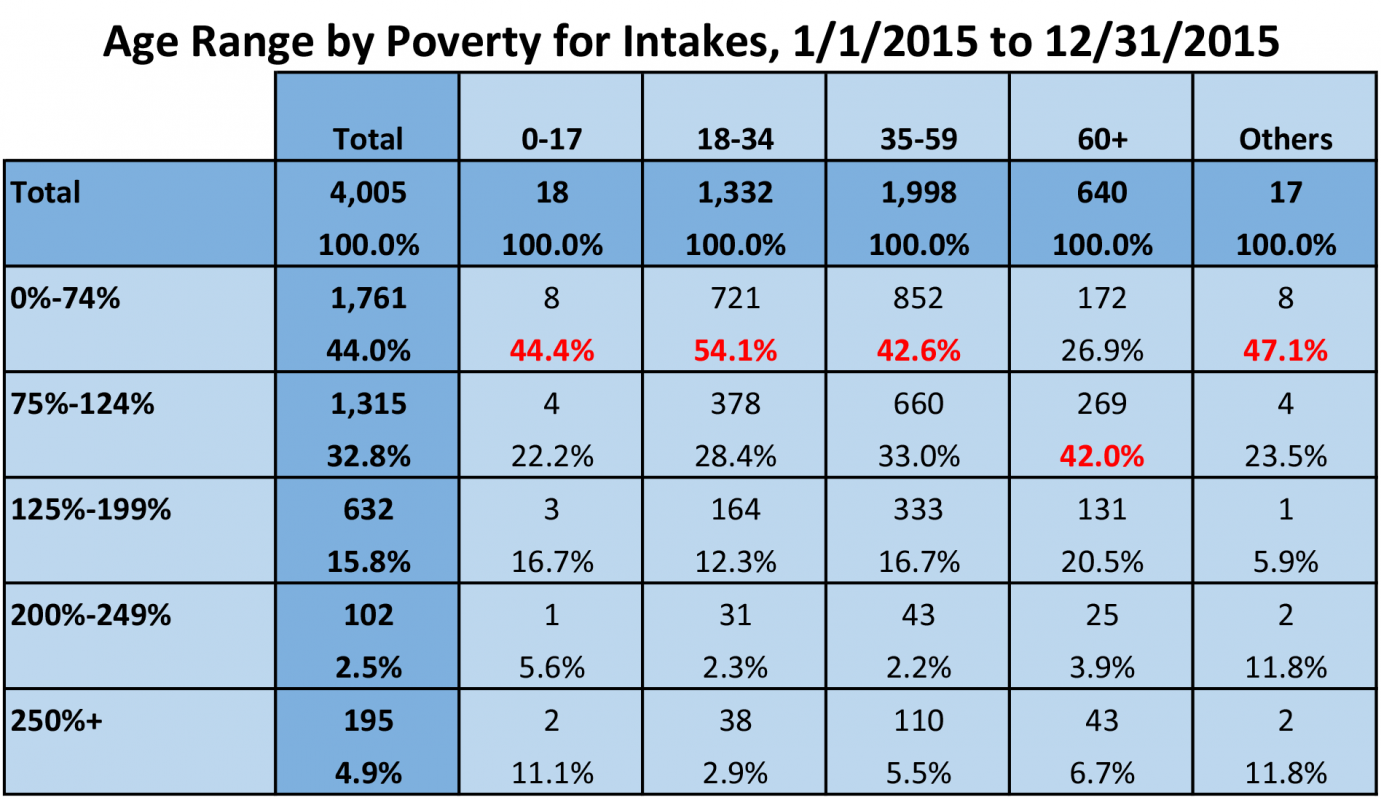
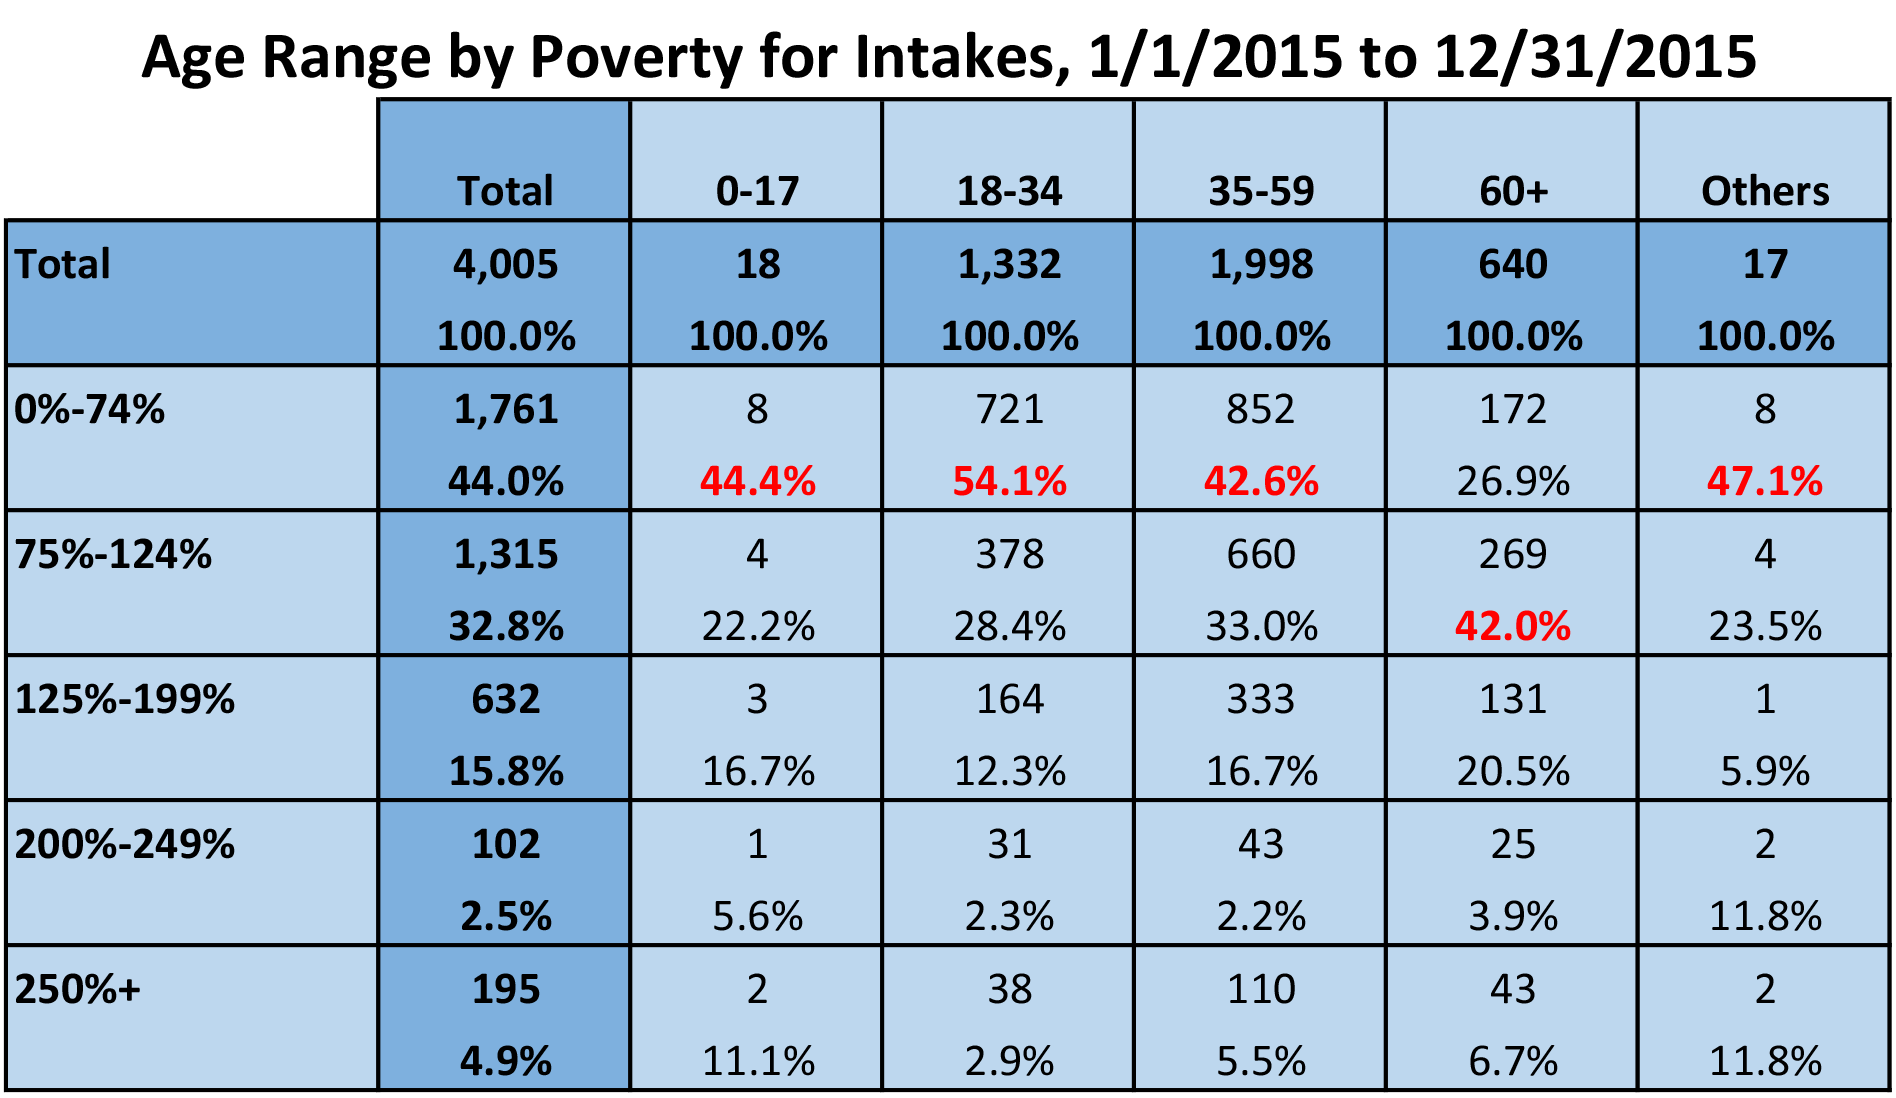
Example Data Question
What are the demographic characteristics (example: age ranges and poverty levels) of the people who requested assistance in the last 12 months?
Multiple Analyses Are Possible
- Are the percentages by various demographics what you would expect? If not, can you explain the difference? For example, did you expect that the largest share of intakes come from clients with poverty levels under 75%?
- How do the demographics of people requesting assistance relate to each other? For example, is the poverty level of older potential clients higher or lower than the poverty level of younger potential clients?
Data Sources
Intake data from your case management system, including
- Demographics about which you are curious
- Open date and close date
- Other case information that you might be able to use in other analyses, including problem code, other demographics, etc.
- Exclude cases that were identified as errors or duplicates, but make sure to keep cases that ended up not being served
Example Analyses Steps
- Collect data about intakes from your CMS for the most recently completed year.
- Create tables, pivot tables, cross tabs, or charts within Crystal Reports, Excel, or whichever analysis software you prefer that show the count and proportions of cases by each demographic characteristic (Crystal Reports cross tab shown in this example).
- Create categories, such as age ranges and poverty levels so the analysis is in summary form and easier to review.
- Use conditional highlighting to draw attention to high percentage, such as red and bold for any percentage 40% or higher.
- Percentages should be considered together with the number of intakes. A high percentage on a low number of intakes may be less significant than a high percentage on a high number of intakes
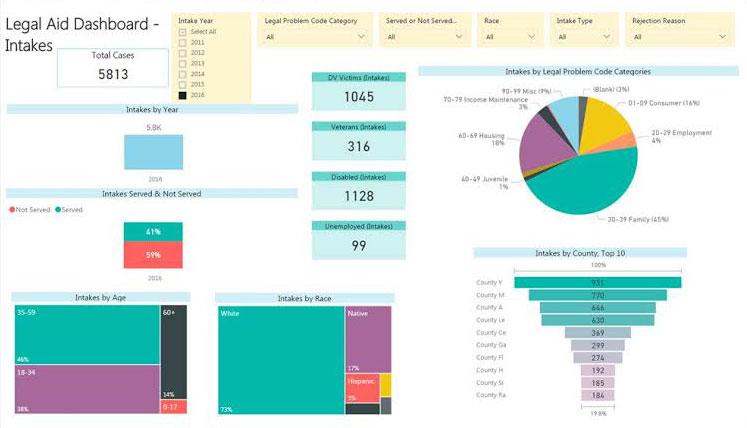
Another Tool for Analysis: Microsoft Power BI (MPBI)
- With your case management system data exported to Excel, you can use MPBI to easily create visuals like the ones in the Intakes Dashboard below.
- Download MPBI Desktop for free at: https://powerbi.microsoft.com/en-us/