Data Questions
Who is eligible?
Who requests assistance?
Who do we help?
How do we help?
What resources are required?
Geographic Distribution
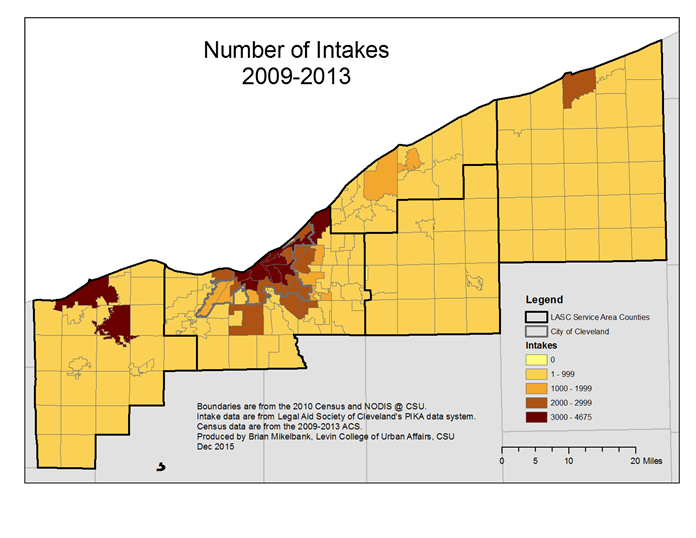
Where do the people requesting assistance live?
Where do people requesting assistance with different demographics live?
Where do people requesting assistance from your defined groups live?
Where do people requesting assistance with certain categories of legal problems live?
Where do people requesting assistance with different legal problems live?
Where do people who request assistance in different ways (walk-in, telephone, clinics, online, etc.) live?
Where do people referred by different outside organizations live?
Geographic Distribution
Geographic Distribution analyses show how people or problems or anything else of interest is distributed across service areas, which can be divided into smaller areas to reveal spatial patterns. These patterns are opportunities to learn about the spatial dimensions of your organization and your clients.
Example Data Question
What is the proportion of intakes from different parts of our service area? In other words, where do the people live who use our services?
Multiple Analyses Are Possible
- Where are the areas with the highest numbers of intakes? Is this surprising to you?
- From which areas do you generate the lowest numbers of intakes? Is this expected?
- If you restrict your interest to different practice areas, do the distributions change?
Data Sources
Intake data from your case management system, including
- Demographics about which you are curious
- Open date and close date
- Other case information that you might be able to use in other analyses, including problem code, other demographics, etc.
- Exclude cases that were identified as errors or duplicates, but make sure to keep cases that ended up not being served
Example Analyses Steps
- GIS mapping using ArcGIS or other similar software.
- To look at these results in tabular format, you would need only to run a frequency distribution on a spatial variable in your case management system. For example, running a frequency of Zip Code or City would produce a count of the number of intakes from each Zip Code or City, from which you could identify the high and low intake areas.
- To map the results, you could start with that same frequency count, and join those data to their corresponding geography file to generate a map.
- In this example, data are aggregated to the community level, and mapped for the service area over a 5-year period. While we would expect higher numbers of intakes in areas with larger populations, there is some interesting variation to note though the region’s urban core.
- Note also, that working with data at this community level did not necessitate “geocoding”, or the process of associating each address from your case management system with a specific location on the map – one only need identify the community.