Data Questions
Who is eligible?
Who requests assistance?
Who do we help?
How do we help?
What resources are required?
Geographic Concentration
Does the geographic concentration of intakes match the concentration of eligible people?
Does the geographic concentration of intakes match the concentration of eligible people with specific demographics?
Does the geographic concentration of intakes match the concentration of eligible people from your defined groups?
Does the geographic concentration of intakes match the concentration of eligible people with specific categories of legal problems?
Does the geographic concentration of intakes match the concentration of eligible people with specific legal problems?
Geographic Concentration
Geographic Concentration analyses compare geographic concentrations (high or low) of multiple variables to determine how the variables and location impact each other. Our concentration maps display location quotients.
Example Data Question
Does location impact clients’ legal issues?
Multiple Analyses Are Possible
- Do common legal issues vary by community?
- Are certain legal issues more concentrated in your service area while others are more widespread?
- Are there links between location and legal issue that could be used proactively?
- Identifying concentration allows you to move beyond questions of “high/low” to questions of “more than expected or less than expected”.
- The location quotient is a commonly used measure of concentration, and it can yield important insights into the data. Learn more about the Location Quotient.
- Are there communities in your service area generating fewer than expected intakes (LQ <1)? Why might that be?
- Are there communities in your service area generating more than expected intakes (LQ>1)? Do you know why?
- Are levels of concentration throughout your service area (the distribution of LQs on a map) the result of a conscious effort on the part of your organization, or is it simply determined by the population seeking your services?
Data Sources
Intake data from your case management system, including
- Legal problem codes about which you are curious
- Open date and close date
- Other case information that you might be able to use in other analyses, including demographics
- Exclude cases that were identified as errors or duplicates, but make sure to keep cases that ended up not being served
Example Analyses Steps
- GIS mapping using ArcGIS or other similar software.
- To look at these results in tabular format, you would need two create a “crosstab” (MS Excel calls them Pivot Tables) from variables in your in your case management system. The rows of the resulting table would be the geography level – cities, for example. The columns would be individual problem codes or problem categories. Reading across each city row in the resulting table, you would know the number of intakes for that city in each problem code category. Reading down a column of that resulting table, you would know the origin of all intakes in that particular category. Thus, it would be easy to determine, just from that table, where the most bankruptcy cases come from (for example), and what the most common legal issue was for a specific community.
- To map these results, some minor processing of that crosstab table would be necessary. The table that you would need to join to the corresponding geography file would need the city as the first variable, and the most common legal issue for each city as its second variable.
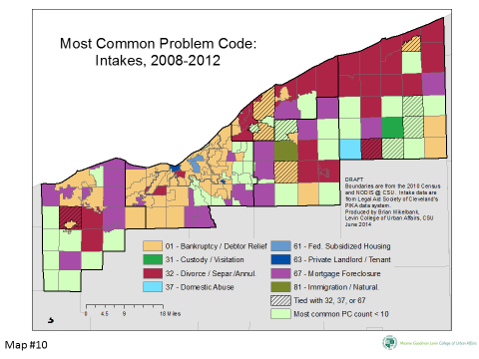
- In our example, some interesting patterns emerge. You can see that Bankruptcy is the most common legal issue in the core of the region. Moving outward, there is a sparse “ring” or purple, corresponding to mortgage foreclosure. Beyond the foreclosure ring, a darker purple is prominent, representing divorce.