Data Questions
Who is eligible?
Who requests assistance?
Who do we help?
How do we help?
What resources are required?
Comparison
How does the number of people requesting assistance compare to the number of eligible people?
How do the demographics of the people requesting assistance differ for different legal problems?
From which defined groups are people requesting assistance with different legal problems?
How do the types of intake (walk-in, telephone, etc.) differ for different legal problems?
How do the referral sources differ for different legal problems?
Comparison
Comparison analyses review linkages between two or more variables and uncover information about client conditions and data relationships. When unexpected data relationships are discovered, investigation is warranted to better understand linkages and determine whether they indicate the need for client service and advocacy work that simultaneously targets multiple conditions at once.
Example Data Question
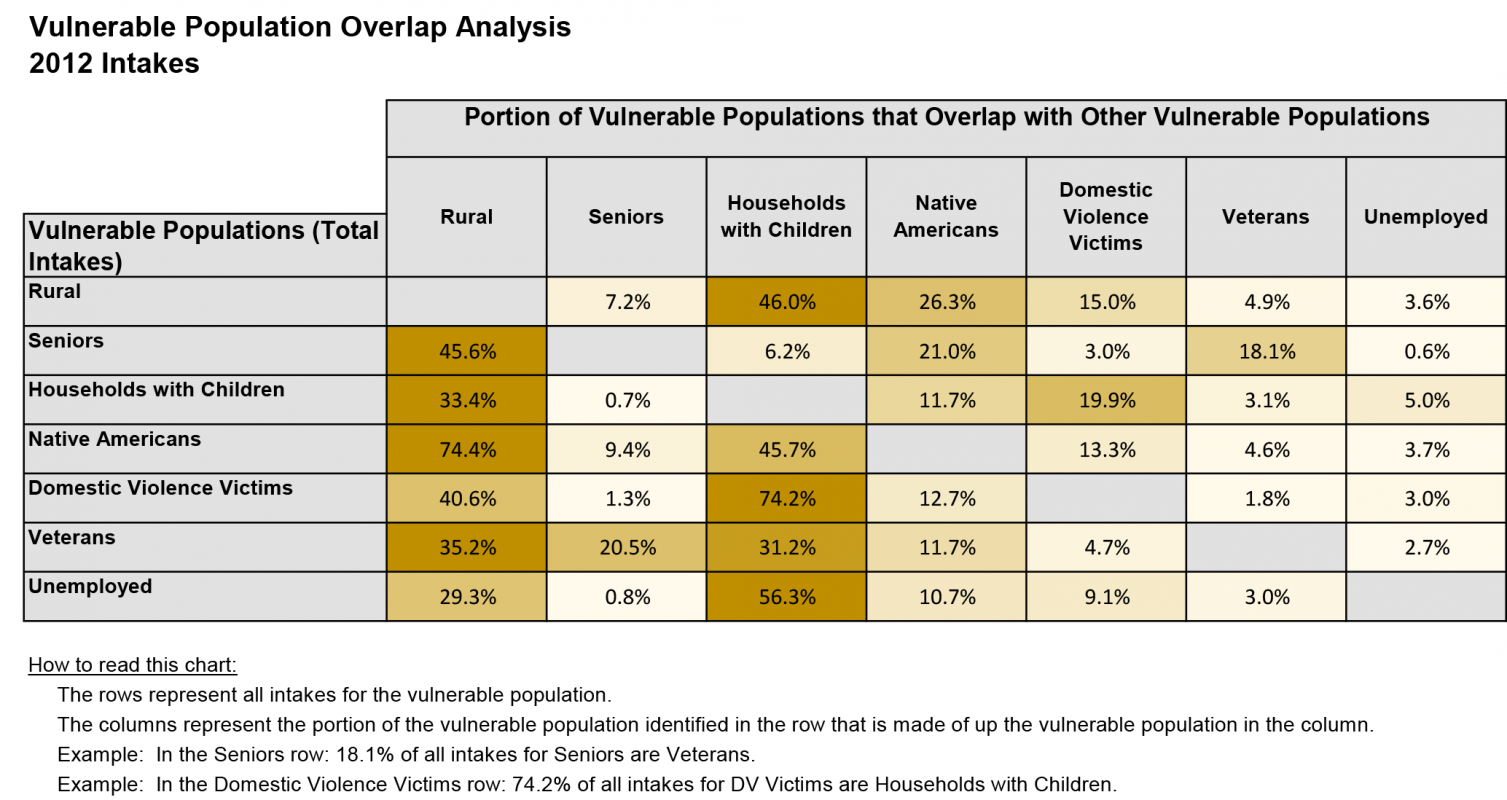
What is the overlap among members of certain vulnerable populations who request assistance from our organization?
Multiple Analyses Are Possible
- Are the eligible people who request assistance vulnerable in multiple ways? If so, are their needs compounded?
- Where is the highest proportional overlap? Does the overlap impact how we can best serve these populations?
Data Sources
Intake data from your case management system, including
- Demographics about which you are curious, especially the fields you use to define your organization’s priority vulnerable populations
- Open date and close date
- Other case information that you might be able to use in other analyses, including problem code, other demographics, etc.
- Exclude cases that were identified as errors or duplicates, but make sure to keep cases that ended up not being served
Example Analyses Steps
- Determine how you will define your vulnerable populations (for example, using age, race, veteran status, etc.) and use formulas to identify which records below to which populations. Note that records can belong to multiple vulnerable populations.
- Gather your intake data along with the newly defined vulnerable population formulas for the most recently completed 12 months.
- Use Crystal Reports cross tabs to calculate the overlap among the vulnerable populations or download the data to Excel and create pivot tables to determine the overlap among your vulnerable populations. You will have to calculate the overlap separately for each population.
- Create a table in Excel in which you enter the percentage overlap figures for all of the populations (see the table below).
- Consider adding graded color scale conditional formatting to the cells to highlight high levels of overlap